This morning we were greeted with the updates in Townsville Bulletin, the Courier Mail, and elsewhere about the flooding event (and ongoing rain) in northern Queensland. Our main concern is for the safety and livelihood of friends, clients and others in the area at this stressful time.
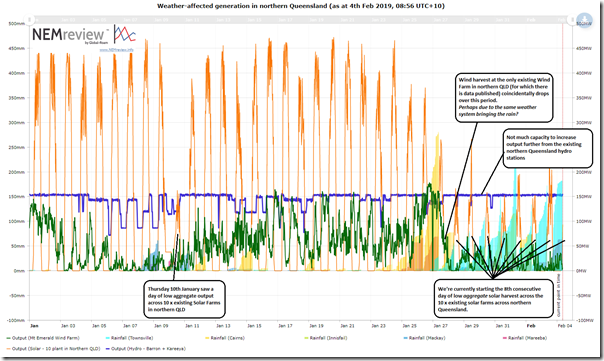
However I did wonder what effect an event like this might have on the level of energy generation from weather affected plant across northern Queensland, so had a quick look with our NEMreview v7 online application to produce this aggregated trend since the start of the year:
With the benefit of the rainfall data we’ve collected from the BOM and are passing through to NEMreview v7, we can see the marked uplift in rainfall measurements for a few sample locations in northern Queensland. It looks like rainfall peaked around Cairns early in 27th January, but that Townsville has copped it since that time.
1) Aggregate solar production reduced by 2/3 into the 8th day
We see in the chart above that the output has been fairly consistently reduced from a prior peak on prior days (of above 450MW) down to a level around 150MW – or a 300MW reduction.
1a) Solar Farms in Northern Queensland
There are 10 x solar farms included in the aggregation above – Ross River, Sun Metals, Clare, Kidston, Daydream, Hayman, Hamilton, Whitsunday, Collinsville and Hughenden (with Rugby Run not yet operational). These are currently operational across Ross (i.e. Townsville) and North (i.e. Mackay) zones, with none yet in Far North zone (centred around Cairns).
I’m not going to go through each individually, but should note the following in particular:
(i) Ross zone solar farms majorly affected
With Townsville being the focal point of the weather currently, it’s no surprise that the solar farms most affected are those in the Ross zone.
1) Ross River Solar Farm has also seen major impact – with a reduction of about 100MW of the 300MW total.
2) Sun Metals Solar Farm has been reduced to very low output over this 7+ day period (particularly 30th, 31st, 1st and 2nd). This has represented almost 100MW of the approx 300MW aggregate decline above.
3) Located just south of Townsville, Clare Solar Farm output has also been slashed – and has completely come offline (i.e. unavailable) since the 29th January. Rebid reasons say “Shutdown heavy rain”. That’s another 100MW.
4) Kidston Solar Farm output seems much less affected.
(ii) North zone solar farms less affected – but smaller
Looking at the North zone solar farms in descending order of registered capacity, we see much less impact on solar production:
1) Daydream Solar Farm output capability has increased in the past couple days, with what looks to be an increase in commissioning limits from 37.5MW to 75MW. However the output has barely hit those levels (perhaps due to cloud cover).
2) Hayman Solar Farm shown no output for a number of days – but perhaps due to commissioning.
3) The Hamilton Solar Farm has seen output drop.
4) The Whitsunday Solar Farm has seen output drop.
5) The Collinsville Solar Farm has seemed less affected (though still not full output)
6) It may be a coincidence to do with commissioning (have not checked further) but I did note that output from Hughenden has picked up from 2MW to 9MW in recent days. Obviously too small to impact on the aggregate number above.
7) Rugby Run Solar Farm not operational, as noted above.
1b) Central and Southern Queensland
Not included in the aggregate above are some other solar farms in central and southern Queensland.
(i) In central Queensland, solar farm output dampened
Even further south in central-west Queensland, we also see an impact:
1) We see that both Barcaldine and Longreach solar farms are also down 50% of so from what would seem to be fairly widespread cloud/rain cover.
2) Output at Emerald did drop earlier in that period (28th through 31st) but is back up now.
(ii) In southern Queensland,
There’s not much in the way of large solar further south yet.
1) Childers is registered, but showing no output.
2) Susan River is currently sporadic – however the little data there is seems to show that it’s unaffected by the weather pattern.
3) Darling Downs Solar Farm has been running with high output.
4) The Oakey plant are not operational yet – I would imagine still recovering from their own weather-related damage from that hail/wind storm a while back.
2) Wind production
Currently we have a statistical sample of only 1 wind farm in northern Queensland for which we have data, so note the usual disclaimers about what that means in drawing conclusions. This is Mt Emerald Wind Farm, located in the Far North zone.
However it is worth highlighting that this particular wind farm is also becalmed over the past 7 days, coincident with the drop in solar production in the Ross zone to the south. Is that purely a coincidence – or is it related to the same weather pattern that’s brought all the rainfall (and suppressed solar production)?
3) Hydro production maxed out
We also see how aggregate Hydro production is maxed out at 150MW following the move from Barron Gorge to full continuous output over the past week or so.
Hypothetically speaking (and notwithstanding possible downstream effects, like flooding) I imagine that any available hydro capacity in northern Queensland (if built) would be running well under the current circumstances?
————-
In this increasingly weather-dependent energy sector we’re moving into with these transitions, real case studies like these will need to be taken into account such that we have sufficient diversity to have robust security of supply.


Leave a comment