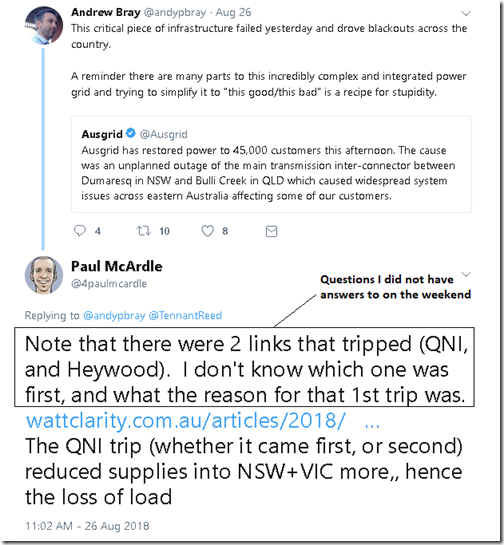
There was a fair bit of interest shown in the islanding event of Saturday 25th August, including in these initial notes here on WattClarity from early that afternoon. The following exchange on Twitter was one of many on social media over the weekend, with this one highlighted because of the questions I flagged:
Coincident with this event, we’ve been starting to explore the inclusion of NEM 4-second SCADA data, published by the AEMO, into our product suite (definitely in some form via ez2view, perhaps also in NEMreview, maybe in something new). Hence we saw the events over the weekend as one way we could drag ourselves up the learning curve with respect to this data set, and what it could show us:
1) About the events of the weekend; and also
2) How we should be utilising the data to further help our clients view our products.
Hence (with the assistance of some of the external consultants we use to drive our products forward) we have had a quick look at some sample SCADA data from around the time of the incident, and present the following thoughts for consideration.
Reader beware, however: my “Training Wheels” are very much in place in dealing with this data set, so it is quite probable that I have made mistakes in interpretation of the data. If you pick up any mistakes, it would be most helpful to us (so we, in turn, can better help our clients by making better software) if you could give us a call directly (+61 7 3368 4064) so you can help me understand what I’ve messed up. Thanks, in advance!
Keeping that (big disclaimer) in mind, we hope this will be of some use:
1) Interconnector flows
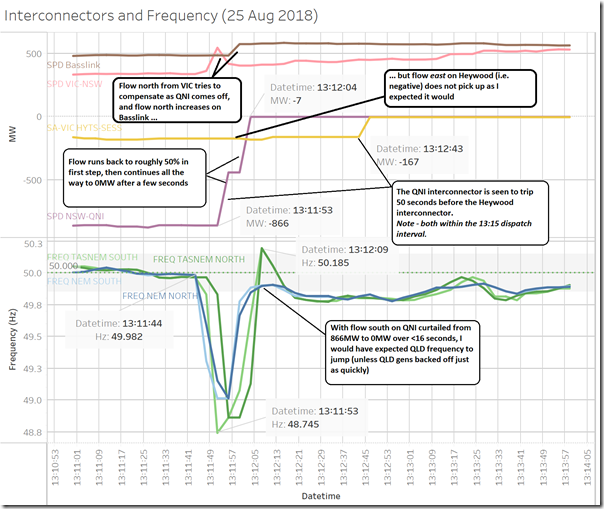
Looking firstly at interconnector flows, we prepared the following chart:
First thing to note about this chart, and most of the others below, is that the cover (just) a 3 minute period within the 14:15 dispatch interval. This period (from 13:10:52 to 13:14:05) incorporates 48 sequential 4-second SCADA readings. With these readings there are, unfortunately, delays that occur in the time-stamping of the data, which leads to difficulties in precise sequencing of events along the lines of “this happened and then that happened”…
There are four main things we can see in the chart above:
Observation #1 = we see that the QNI flow dropped from 866MW south to 0MW over a period of less than 16 seconds. This happened in two steps – first to 50% and then to 0%. I wonder if this is not indication of the “mal-operation” that AEMO referenced in Market Notice 64012 published at 17:52 on Saturday 25th (i.e. was it meant to reduce to 1/2 load and stay there?)
“External Reference Cancellation of a Non-Credible Contingency Event: Simultaneous trip of 8L and 8M Dumaresq – Bulli 330 kV Transmission lines as a credible contingency lines in NSW due to protection mal-operation.
Cancellation of reclassification of a non-credible contingency event as a credible contingency event due to protection mal-operation.”
Observation #2 = we see that, as QNI was coming offline, flow north from Victoria and Tasmania increased to try to compensate – and yet Heywood is not seen to do anything. I wonder why this was the case?
Observation #3 = we see that Heywood apparently remained operating (and at a steady rate) for a full 50 seconds before tripping. Why it tripped I still don’t understand – especially if it happened to trip a full 50 seconds afterwards?
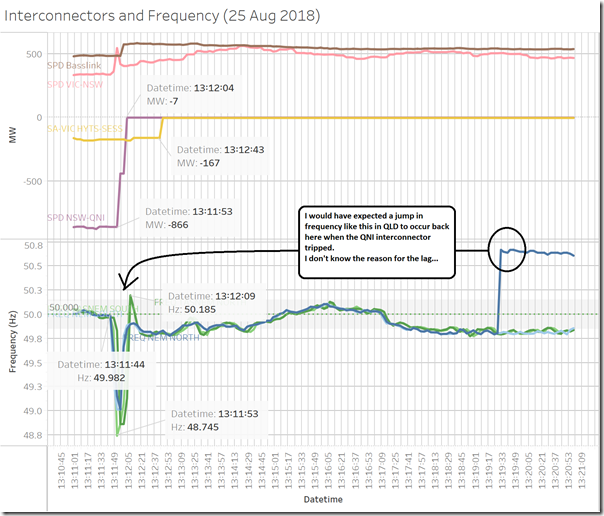
Observation #4 = we see that (according to the data), the frequency in “NEM North” (i.e. Queensland) did not climb through the roof as I would have expected. Instead, if we expand out the time-range below, we see that the data suggests that this did not happen until 13:19 – I do not understand how there could be such a time-lag? Was this due to a time-stamping problem?
It certainly seems that there might be some form of measurement, or time-stamping, problem?
2) Major loads
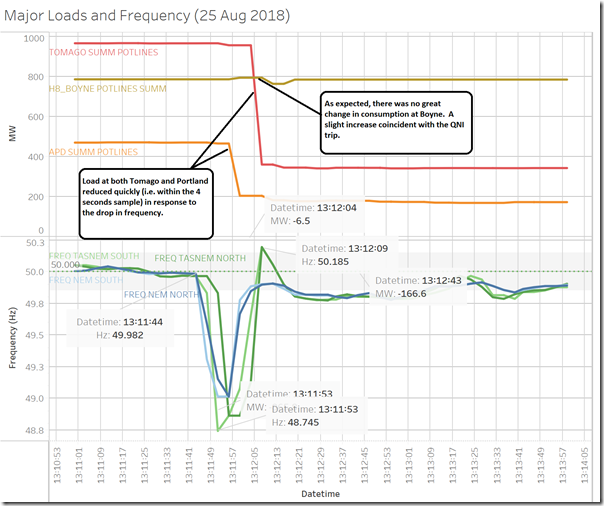
Next, taking a look at load at three aluminium smelters, in conjunction with the frequency:
Observation #5 = we see the Automated Under-Frequency Load Shedding (UFLS) system triggered reductions in load at both Tomago Smelter (in NSW) and at Portland Smelter (in VIC).
Observation #6 = worth also noting that the output at Boyne did not drop, which is what we expected. It’s also another indication that there is an error in the data for frequency at “NEM North”, as the output increases slightly (does not drop) coincident with the trip of QNI (i.e. Observation #4).
3) Selected Generators
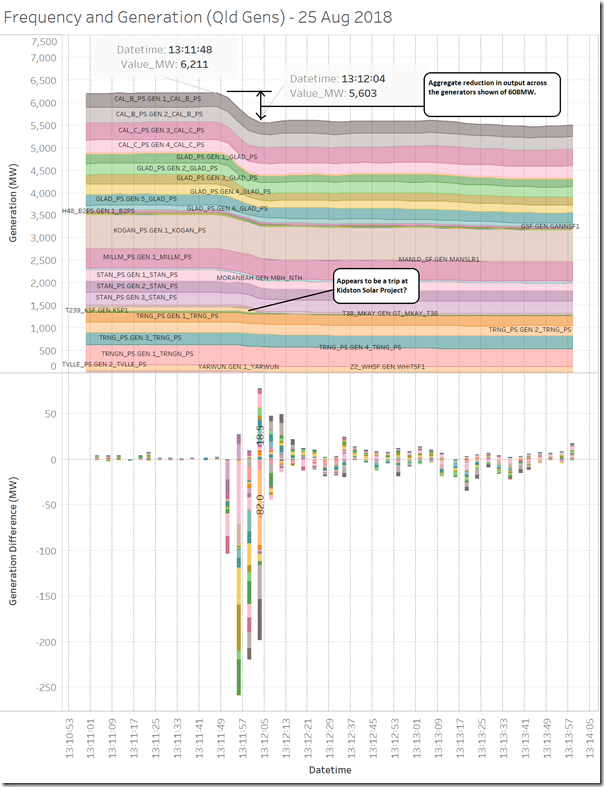
Starting with a stack of output at selected larger Queensland generators, we see that their cumulative output ramped down quickly in response to the trip of QNI – as I had expected to see:
Observation #7 = total reduction shown in the chart is 608MW, which is lower than the loss of access to the NSW region (866MW) – but I suspect that this is just because we’re not 100% correct in the stations selected. Have not checked thoroughly…
Observation #8 = I’ve also noted that there looks like a trip at Kidston Solar Project, which might have happened in response to the high frequency we think QLD would have been seeing at the time (but is not shown in the chart above, as noted in Observation #4). A small point, but this is also a slight deviation from the AEMO said in Market Notice 63985 where they noted NIL generation tripped with the event (we presume the most attention was focused on the bigger generators).
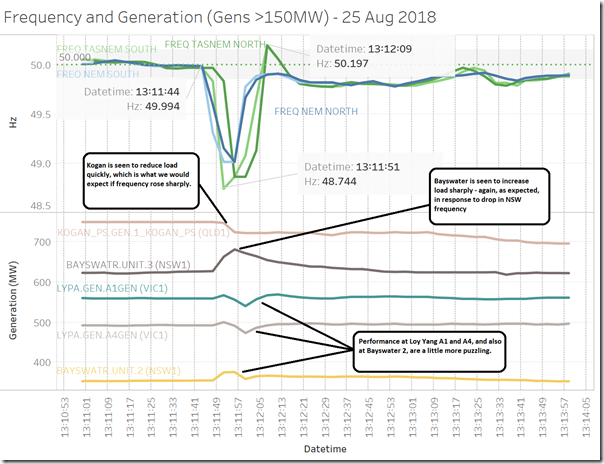
Taking a sample of the bigger generators across some regions, we see the following:
Observation #9 = The way that both Kogan (reduced quickly with presumed frequency rise) and Bayswater #3 (increased quickly with frequency drop) appear to have performed is as we expected.
Observation #10 = However the “up then down” output of Loy Yang A1 & A4, along with Bayswater #2, are a little more puzzling for me. Perhaps I am missing something?
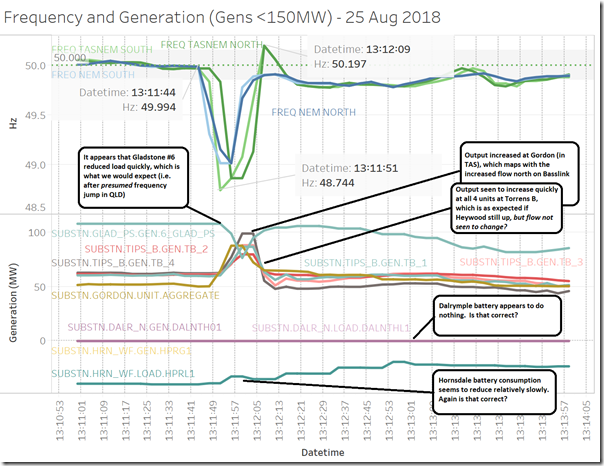
Taking a look at a mix of smaller plant, we have the following chart:
There are a number of things that seem to make sense in this chart, and some things that don’t:
Observation #11 = It seems that Gladstone Unit 6 output reduced quickly in response to a presumed spike in frequency – however it just as quickly increased output, which is something that does not immediately make sense. Perhaps I am missing something?
Observation #12 = We see that output from all 4 x Torrens B units increases sharply (which seems to make sense if Heywood was still connected at that time – however the trend of flow above seems to suggest no increased flow to the east) but then reduces just as quickly (which does not make as much sense). Perhaps I am missing something?
Observation #13 = We see that output from Gordon increases sharply to supply the mainland, and this seems to line up with the temporary increase in flow north on Basslink (i.e. in the time it took for Portland smelter to trip).
Observation #14 = Two things that are puzzling are that the batteries (Hornsdale, and Dalrymple) don’t behave as would be expected if frequency in South Australia was to drop sharply whilst still connected to Victoria. Again, this might have something to do with my same puzzlement about Heywood flow not being seen to change for 50 seconds (Observation #3)?
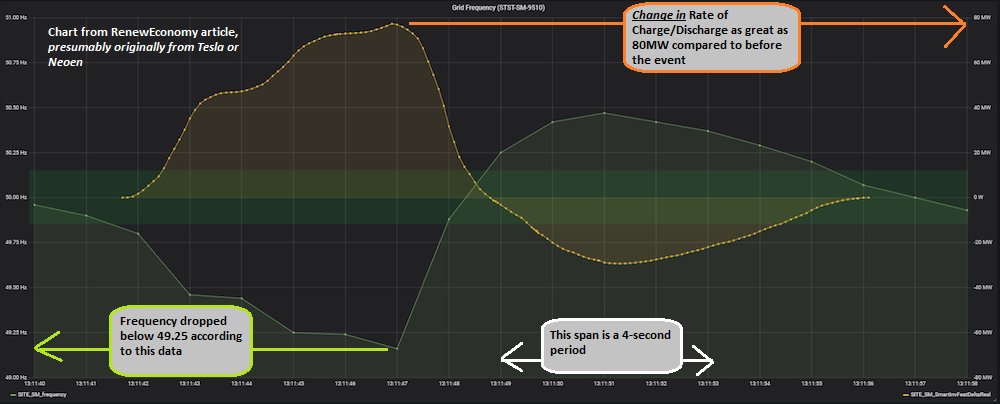
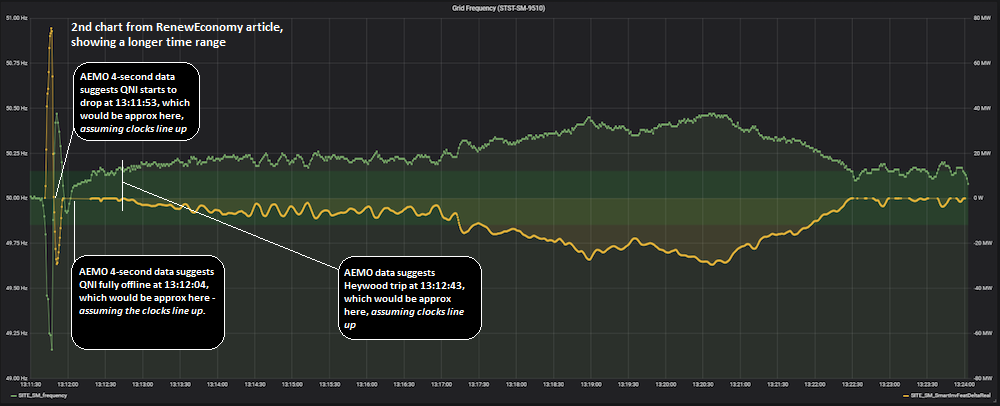
PS interesting that also on Monday this article was posted on RenewEconomy and included two charts focused specifically on the Hornsdale battery over two periods following the separation event. The charts contain 100 milli-second data (so presumably coming from Tesla or Neoen), so are at an even better resolution than the 4 second data provides.
Here’s the first one, marked up with some comments (click on the image for a larger view):
Here’s the second one, again with some comments (click on the image for a larger view):
A couple points:
1) Readers should note that the “output” data has been re-zeroed to show change in rate of charge/discharge relative to where it was at when QNI tripped (i.e. was charging then at approx -40MW)
2) The data is more like I expected to see, so I wonder what’s the reason the 4-second data does not show the jump to a discharge of approximately 40MW (i.e. 80MW change) within the first few seconds.
3) Where I’ve annotated that (according to the 4-second data) Heywood tripped, I would have expected to see frequency in the (then islanded) SA region jump again, as it had been supplying VIC. However that does not seem to be the case, which makes me wonder if the trip was not earlier than the 4-second data seems to suggest?
Alas more questions…
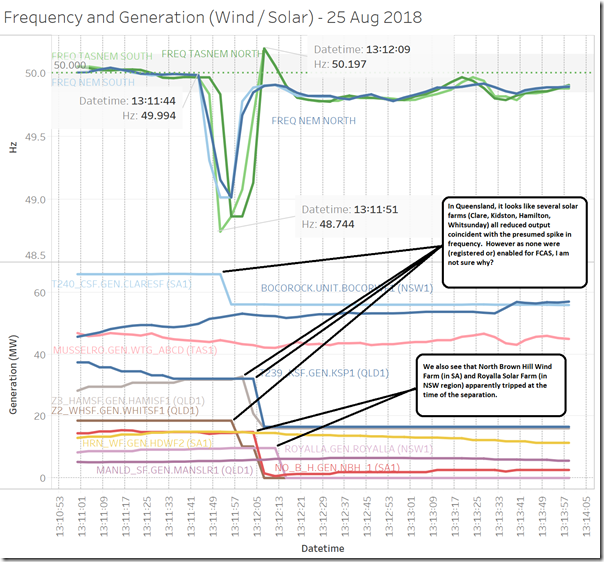
Finally, taking a look at some wind and solar plant reveals a few more questions, unfortunately…
Observation #15 = Of the plant selected, it appears that 6 intermittent plant (5 solar farms and 1 wind farm) all dropped output coincident with the interconnector trip (with one tripping entirely) – but none of these have been (registered for or) enabled for FCAS. Hence this would suggest some form of technical fault at each of the plant, unless I am misunderstanding something?
Please accept my apologies that this post seems to pose more questions than provide answers at this point. Unfortunately I am still puzzling at many things currently…


At the time I just happened to check my solar inverter on a sunny day in southern Victoria, expecting to see high output. But instead its screen was going through what seemed like a boot-up procedure, then after finishing this there was the “clunk” of the relay and it began showing its power output. This is worrying from a system point of view, that a new inverter (Fronius) tripped out with a rapid change of frequency. At that time Opennem shows 802 MW of roof-top solar in Victoria. If much of this were to trip because of bad fault ride-through settings, a lot more load-shedding would be required.
Perhaps AEMO needs to commission some physical tests of inverters under simulated rapid changes in frequency, rather than trusting manufacturer specifications. Inverters that fail are then banned from the Australian market.
If it is “quite probable” that mistakes are made, is this article suitable for publication?
WRT the question in observation #4, it doesn’t look like there is a significant time stamping issue because the small frequency deviations seem to match quite well between the measuring devices.
The drop then rise you are talking about in observation 10 (and others) looks like inertial response to me. That will look like a response proportional to the rate of change of frequency. It is governed by the physics of the machines. So not really a controlled response.
So I would say for Loy Yang, Bayswater, and Gladstone there was no governor response or there was but it was too slow to see in that time domain.
Thank you Paul for this excellent article.
Regarding Observation #15, I believe the decrease of the output of the 6 renewable generators is consistent with the frequency control they must implement to meet the requirements of clause S5.2.5.11 of the National Electricity Rules. Given the capability of power electronics based generation, these generators are probably registered with an Automatic access standard to clause S5.2.5.11, i.e. they must reduce their active power output by at least 20% of their maximum output for each 1% frequency increase above the upper limit of the normal operating band (being 50.15 Hz on the mainland).
This frequency control is a security measure to prevent the power system to collapse. All generators implement such a control regardless their participation to the FCAS market.
Solar farms won’t be able to propose an Automatic Access Standard under clause S5.2.5.11 since they generally cannot increase active power output in respond to a reduction in system frequency (S5.2.5.11 (b) (3)). It is more likely to be a Negotiated Access Standard which can meet S5.2.5.11 (b) (1) and (2). And if they are not going to participate in the low FCAS market, they do not need to activate this function. They simply just need to demonstrate that they are capable of doing so. But I know that some plants enable the function without fully understanding the consequence.
As you wrote, solar farms only need to demonstrate they are “capable of”. If they are not dispatched at their MPP, they can increase their output in response to a frequency fall. So they can propose an Automatic Access.
AEMO June 2018 report which discusses non credible event of a QNI trip from high load has some interesting facts.
I’ve carried out lots of plant failure analyses even back to the days of sprecher & schuh relays and you’re on a hiding to nothing trying to use 4 second data especially when you don’t have access to the source of the scans.
There will always be timing issues when different systems are involved. And even though a time is assigned to a scanned value you have no idea of the exact time the data was actually collected.
Modern failure analysis relies on high speed monitoring systems runnng independently of the process control system. While all the above comments are interesting, I suspect none of the data AEMO is currently providing has the required level of integrity to allow for the sort of analysis required.
Re Observation #4
Yes, I think you have a timestamp issue there. I log line frequency in SEQ with 10 second intervals, and here’s what I saw:
2018-08-25 13:11:20, 49.980
2018-08-25 13:11:30, 50.000
2018-08-25 13:11:40, 50.542
2018-08-25 13:11:50, 50.642
2018-08-25 13:12:00, 50.592
2018-08-25 13:12:10, 50.582
2018-08-25 13:12:20, 50.622
2018-08-25 13:12:30, 50.612
2018-08-25 13:12:40, 50.642
2018-08-25 13:12:50, 50.642
2018-08-25 13:13:00, 50.673
2018-08-25 13:13:10, 50.693
2018-08-25 13:13:20, 50.733
2018-08-25 13:13:30, 50.753
2018-08-25 13:13:40, 50.753
2018-08-25 13:13:50, 50.733
And here’s the output of my SolarEdge inverter in watts, you can see it bailed early….
2018-08-25 13:11:20, 1750.0
2018-08-25 13:11:30, 1750.1
2018-08-25 13:11:40, 1658.8
2018-08-25 13:11:50, -3.9
2018-08-25 13:12:00, -4.3
Perhaps SA should consider high-speed inter-tripping to shed SA LOAD when Heywood is overloaded in the import direction and to trip WIND GENERATION when OVERLOADED in the export direction.
Stated power supply from QLD to NSW prior to the incident: 866MW
The QNI capacity of both[1:] circuits is 1078W[2:]. Both circuits must have been in operation to carry 866MW.
Q1: If you want a single failure proof QNI interconnector, then what is the maximum permissible load on both circuits of the interconnector?
A1: 539MW, preferably shared half and half.
Q2: If you do not operate in a single failure proof manner, then what are the consequences of a single circuit failure for any reason?
A2: A cascade trip of the second circuit, that leads to a systemwide transient that is only halted by a AUFLS trip of both Tomago and Portland smelters. The QNI trip shed 866MW of supply and the smelter load shed 850MW of demand. A neat fit that made the transient survivable without a total system black.
Tomago drops 600MW
Portland drops 250MW
Q3: Why would AEMO expect any different result?
A3: Because they have not learnt the lessons of the SA statewide blackout. Is AEMO going to make a habit of doing this[3:] ?
[1:]
https://en.wikipedia.org/wiki/Queensland_E2%80%93_New_South_Wales_Interconnector
The Queensland – New South Wales Interconnector (QNI) is a 330 kV AC interconnection between New South Wales and Queensland, Australia. The link was commissioned in 2001. It consisted of double-circuit 330 kV lines between Armidale, Dumaresq, Bulli Creek and Braemar, and a double-circuit 275 kV line between Braemar and Tarong.[1
[2:] Stated power supply from QLD to NSW prior to the incident: 866MW
The QNI capacity of both[1:] circuits is 1078W[2:]. Both circuits must have been in operation to carry 866MW.
Q1: If you want a single failure proof QNI interconnector, then what is the maximum permissible load on both circuits of the interconnector?
A1: 539MW, preferably shared half and half.
Q2: If you do not operate in a single failure proof manner, then what are the consequences of a single circuit failure for any reason?
A2: A cascade trip of the second circuit, that leads to a systemwide transient that is only halted by a AUFLS trip of both Tomago and Portland smelters. The QNI trip shed 866MW of supply and the smelter load shed 850MW of demand. A neat fit that made the transient survivable without a total system black.
Tomago drops 600MW
Portland drops 250MW
Q3: Why would AEMO expect any different result?
A3: Because they have not learnt the lessons of the SA statewide blackout. Is AEMO going to make a habit of doing this[3:] ?
[1:]
https://en.wikipedia.org/wiki/Queensland_E2%80%93_New_South_Wales_Interconnector
The Queensland – New South Wales Interconnector (QNI) is a 330 kV AC interconnection between New South Wales and Queensland, Australia. The link was commissioned in 2001. It consisted of double-circuit 330 kV lines between Armidale, Dumaresq, Bulli Creek and Braemar, and a double-circuit 275 kV line between Braemar and Tarong.[1
[2:]
https://www.aemo.com.au/-/media/Files/Electricity/NEM/Security_and_Reliability/Congestion-Information/2017/Interconnector-Capabilities.pdf
QNI nominal capacity From To Nominal Capacity
Queensland NSW 1078 MW
[3:]
http://wimnet.ee.columbia.edu/wp-content/uploads/2015/10/Analysis_of_Failures_in_Power_Grids.pdf
Analysis of Failures in Power Grids