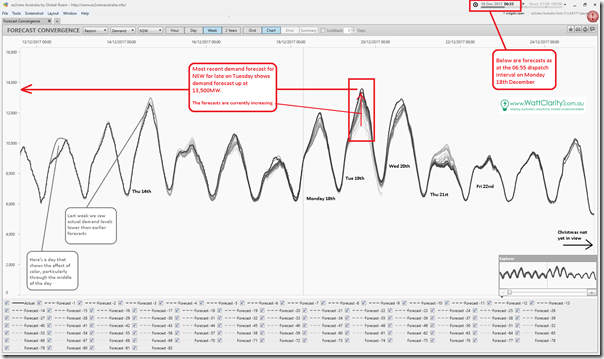
Worth highlighting at this point (using the Forecast Convergence widget in ez2view) that successive demand forecasts for NSW looking out a week into the future flag what’s currently an increasingly hot weather forecast for NSW late tomorrow afternoon (i.e. Tuesday 19th December at 16:30 NEM time) where demand is currently forecast to peak up above 13,500MW:
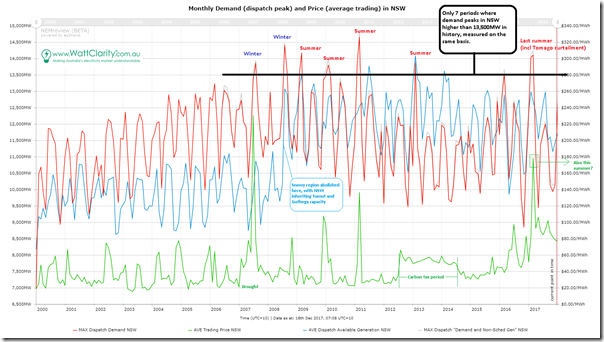
This would be (if it eventuates) only 1,000MW below the all-time record, which would be a noteworthy outcome given the demand destruction since the peak was previously set in summer 2010-11 (e.g. the closure of Kurri Kurri aluminium smelter), and fresher memories of what happened when demand peaked up above 14,000MW on 10th February 2017 in NSW, with both these extremes seen in this trend from NEMreview v7 :
As time permits this summer we’ll post more on WattClarity.
PS – a little later on Monday…
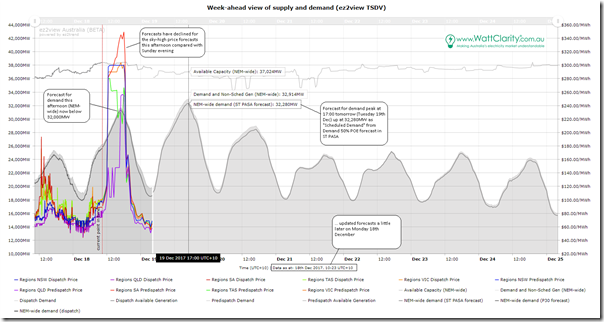
After a bit of exploration in the web-based “Time-Series Data Viewer” widget within ez2view, I’ve assembled a chart that provides a NEM-wide view of forecast demand for the week ahead, bridging together the P30 predispatch data and also the ST PASA data. It also shows both common measures of demand:
1) What AEMO calls “Scheduled Demand”, which is the measure they have historically used; and
2) Something AEMO publishes that approximates “Operational Demand”, which takes into account demand met by non-scheduled generation.
As noted on the chart, forecast for Scheduled Demand later today (NEM-wide) has now dropped below 32,000MW (meaning the cancellation of the LOR1 notices and the drop in prices forecast earlier in predispatch). The forecast for tomorrow is that Scheduled Demand will still rise above 32,000MW NEM-wide.
For clients using ez2view, you can access a live updating (and editable) version of this, either:
1) Online in any browser here; or
2) [COMING A LITTLE LATER] we’ll also have a live updating but non-editable trend chart for “Week-Ahead NEM-Wide Supply & Demand Forecast” in your installed copy of ez2view from the “ez2view explorer” – which you’ll be able to find by searching for “NEM-wide”, for instance.


Interesting also that it is only the second December that we have seen values over 13GW (currently 13,010). Given that historically Jan and Feb have been higher, it could be an interesting summer. Off to fire up my BBQ and watch the summer with interest.