You know the situation is getting serious when you see alerts like this one from the Queensland Premier on Twitter (around 12:00 on Monday 27th March):
For comparison purposes, here’s a few other records we’ve provided on WattClarity over the years:
| January 2014 | Posted here about ex TC Dylan reducing electricity demand by what seemed to be about 50MW. |
| February 2011 | I posted two articles (here and here) using a very early version of ez2view for the Nostalgics looking at how demand was moderated with the onset of TC Yasi. |
| March 2006 | TC Larry was the other big one in recent times, but too early for us to post anything on WattClarity. |
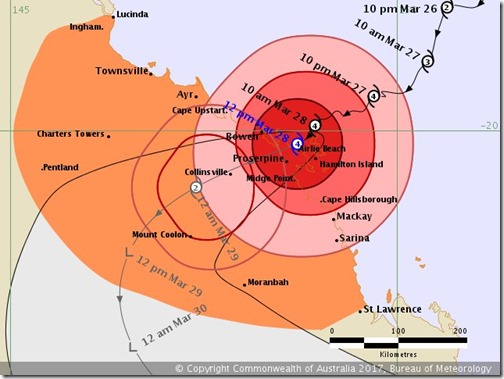
As I sat down to write this post, in between distractions, (12:30 on Tuesday 28th March) the cyclone is crossing the coast around Proserpine – so about mid-way between Mackay and Townsville. This is shown in the 12:00 update from the Bureau of Meteorology in terms of the path of the cyclone:
Current news bulletins talk about the cyclone being slow moving – perhaps taking 18 hours to traverse the coastal areas (and then continuing inland as shown).
(A) Effect on Electricity Consumption
Given our keen interest (on WattClarity, in the ECA Consumption Widget, and in the software we provide to a diverse range of clients) in electricity consumption, it was natural that I would ask what impact it was having on electricity consumption. Now this might happen for a number of reasons – including the following 3 big ones (and one perhaps less obvious):
Reason 1 = with everyone hunkered down to avoid the storm (businesses and schools shut, etc…) electricity consumption will be naturally lower
Reason 2 = with temperatures lower by virtue of the storm, air-conditioning load will be reduced.
Reason 3 = there, of course, is the probability that supplies will be cut to large numbers of electricity consumers as debris brings down power lines, etc… – this tweet (13:20) quotes an EnergyQLD representative talking about 38,000 customers already reported as disconnected:
Reason 4 = the “demand” figure measured by the Powerlink data effectively “sees” injections from distributed solar PV as negative consumption. In the days prior to the arrival of TC Debbie I presume that there will have been some injections from small-scale solar PV in northern Queensland, but that this output will have been reduced to virtually nothing over a large area given the cloud cover. This means that, comparing “before” and “now” in the chart below, we need to remember that actual consumption in the days “before” will actually have been higher than shown, by virtue of the solar PV injections.
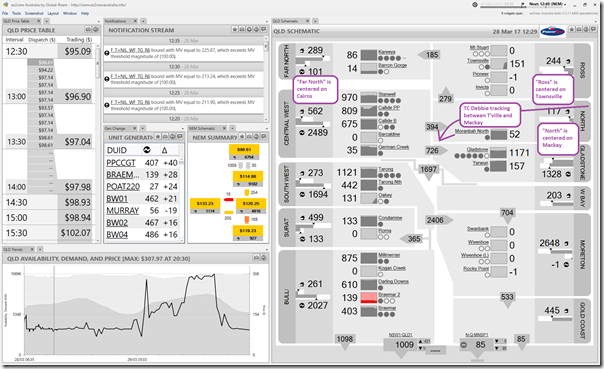
For background, I have included a snapshot from our ez2view software that incorporates a live view of intra-regional transmission flows and zonal consumption for 11 “transmission zones” throughout Queensland, as defined by Powerlink:
I’ve annotated the schematic zonal representation of the Queensland region provided therein to illustrate how the path of Cyclone Debbie is tracking between the centre of the Ross zone (i.e. Townsville) and the centre of the North zone (i.e. Mackay).
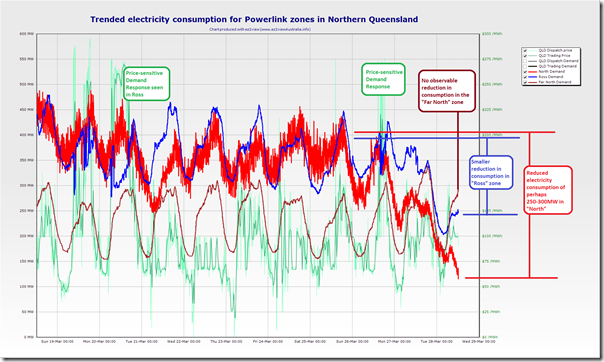
Pulling out a week’s worth of historical data for the three zones in northern Queensland to produce this trend, we can see that the cyclone has dampened electricity consumption significantly in the North and Ross zones, but there does not seem to be observable dampening further north in the “Far North” zone:
Summing together the reductions obvious in the North and Ross zones, it seems likely that TC Debbie has led to a demand reduction of at least 400MW, and perhaps significantly more than that because of Reason #4 above.
Note that I have also highlighted some evidence of price-sensitive demand response in the Ross zone in the days leading up to the event.
(B) Wind Speeds
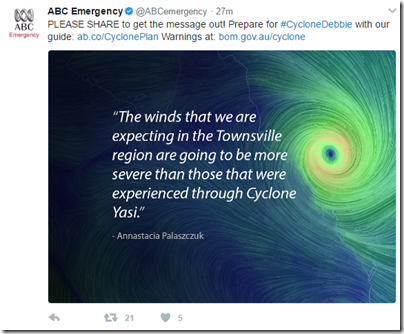
During the day we saw updates like this on social media talking about wind gusts :
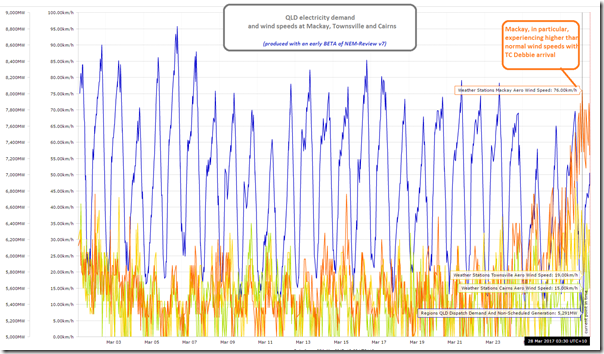
Given that we’re working intensively on a new version of NEM-Review (existing clients already have access to an early beta, so they can feed suggestions into the development process) I thought it might be a useful test case for looking at what was apparent.
First thing I noticed was that we’ve included (in the current beta) BOM data for only Mackay, Townsville and Cairns – though I think that we have access to a broader number of measurement points in the area. It’s now logged as Job # 9523 in our internal job tracking system.
Here’s what we can currently show:
As can be seen, certainly higher wind speeds being recorded, but nowhere near the maximum gust speeds noted above – we’ll need to investigate why. Logged as Job #9524.
(C) Consumer Safety
Storms and electricity don’t mix – that’s always been the case.
However with increasing penetration of distributed energy solutions (large numbers of solar PV installations, and a growing number of batteries being installed) the degree of complexity increases given that energy flows on the network can increasingly be 2-way and hence the risks of electrocution after a storm increases if correct precautions are not taken (and correct design not implemented in the first place).
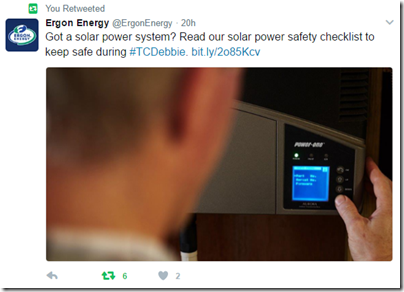
That’s why I was happy to see (and re-tweet) this timely reminder from Ergon last night:
It’s also why we’re working with the Australian Energy Storage Council to build a national Energy Storage Register, for reasons explained here.




Be the first to comment on "[POSTED 13:40] TC Debbie dampens electricity consumption in Queensland"