

Eleven days ago (on an eventful 12th October 2026) amongst other things we wrote about how ‘Baseload Futures prices climbing, into 2026 Q4’.
Since that time, we’ve started collating a few articles here with respect to this medium-term pattern change – including:
1) Some of the contributing factors; but also
2) Noting this ‘… framework for exploring what factors were contributing to …’:
(a) not just the volatility that happened on that day, and in NSW; but also
(b) the broader pattern of price rises seen in futures pricing.
We had intended to continue this analysis, with different factors individually assessed and added in a series of articles (and indeed had started some number crunching) – but that had been in dribs and drabs, in between other business.
But Angela’s article ‘Super El-Nino threat rattling power markets: Origin CEO’ in the AFR on Tuesday afternoon (and a number of updates from retail brokers on social media that I saw) were prompts for me to resurrect this analysis+article noting one other factor that was not really noted directly in Angela’s article, or in the social media updates I saw.
1) For context, Angela’s article begins:
‘Origin Energy chief executive Frank Calabria has blamed the increased risk of a super El Nino weather event hitting Australia this summer for a sharp uptick in wholesale power prices that has exposed how finely balanced the electricity market remains ahead of coal power plant closures.’
2) And is worth reading in detail, for those who have access (not just for reporting on what Frank Calabria said).
What we noticed a couple weeks ago (and discussed with some clients and prospects on calls) was a noticeable change in bidding patterns (and, in particular, the price offered) at a number of coal fired generators in the NEM. We know that these have been seen by at least some financial traders – and hence would assume that these changed settings have fed through to expectations for spot prices in the months ahead (and hence futures prices).
I don’t have time for much more today, but want to just leave readers with a bunch of snapshots from the ‘Bids & Offers’ widget in ez2view v9.20 – with each image set up identically:
1) Time-travelled back to 24:00 ending Wednesday 21st October 2026 (i.e. 3 weeks into 2026 Q4);
2) Looking backwards 60 days (hence back to, and including 23rd August 2026 … i.e. deep into 2026 Q3);
3) Filtered to a particular coal unit portfolio
4) Using a variation of the default Blue-Green-Red colour coding for bid ranges;
(a) which has featured in many articles here – including:
i. many articles using the ‘Bids & Offers’ widget in ez2view over the years;
ii. but also a smaller set of articles that have trended a much longer range of data (typically aggregated by day or by month) catalogued here under Bids in ‘blue, green and red’.
(b) With the variation being to add in a larger number of bid ranges (with $10/MWh spacing) between $0/MWh and $90/MWh (i.e. the traditional SRMC price ranges for coal units) in order to make these changes more immediately visible.
5) With relevant spot prices shown;
6) And the table on the right specifically focused at the bid structure of the filtered unit at 00:00 (NEM time) beginning Thursday 22nd October 2026:
(a) which was semi-randomly chosen (with the main driver being in 2026 Q4);
(b) but scrolling ‘off the page’:
i. so not showing the full picture.
ii. but aiming to show some actual bid price bands at the RRN for the relevant unit(s) … albeit sometimes I forgot to do the scroll before the screenshot.
A big note of caution.
Before we get into the results, a reminder to readers here:
1) None of the results that follow are intended to speak to any particular motivation
2) We do understand:
(a) that some readers might have a tendency to infer motivations to certain behaviours
i. and hence to some market outcomes
ii. in some cases, some readers might even tend to to ascribe ‘blame’.
(b) but these are only guesses … and may be quite a diversion from reality.
So with the above framework (and this caution) in mind, here’s about a dozen snapshots from ez2view filtered to each coal unit portfolio:
Brown Coal units (in VIC)
Note that we’ve separated out the brown coal units separate from black coal units because that’s the current structure of the ‘Quick filter’ in ez2view, but also because we wanted the process to be more clearly apparent to the reader in a simple snapshot here (i.e. if we use ‘Power filter’ we have many more degrees of freedom in assembling … but the design of these are not so apparent in a simple snapshot).
There are three coal unit portfolios consuming brown coal in Victoria.
AGL Portfolio (Brown Coal units only)
Here’s a snapshot for the AGL coal units in Victoria … which are the 4 x Loy Yang A units:
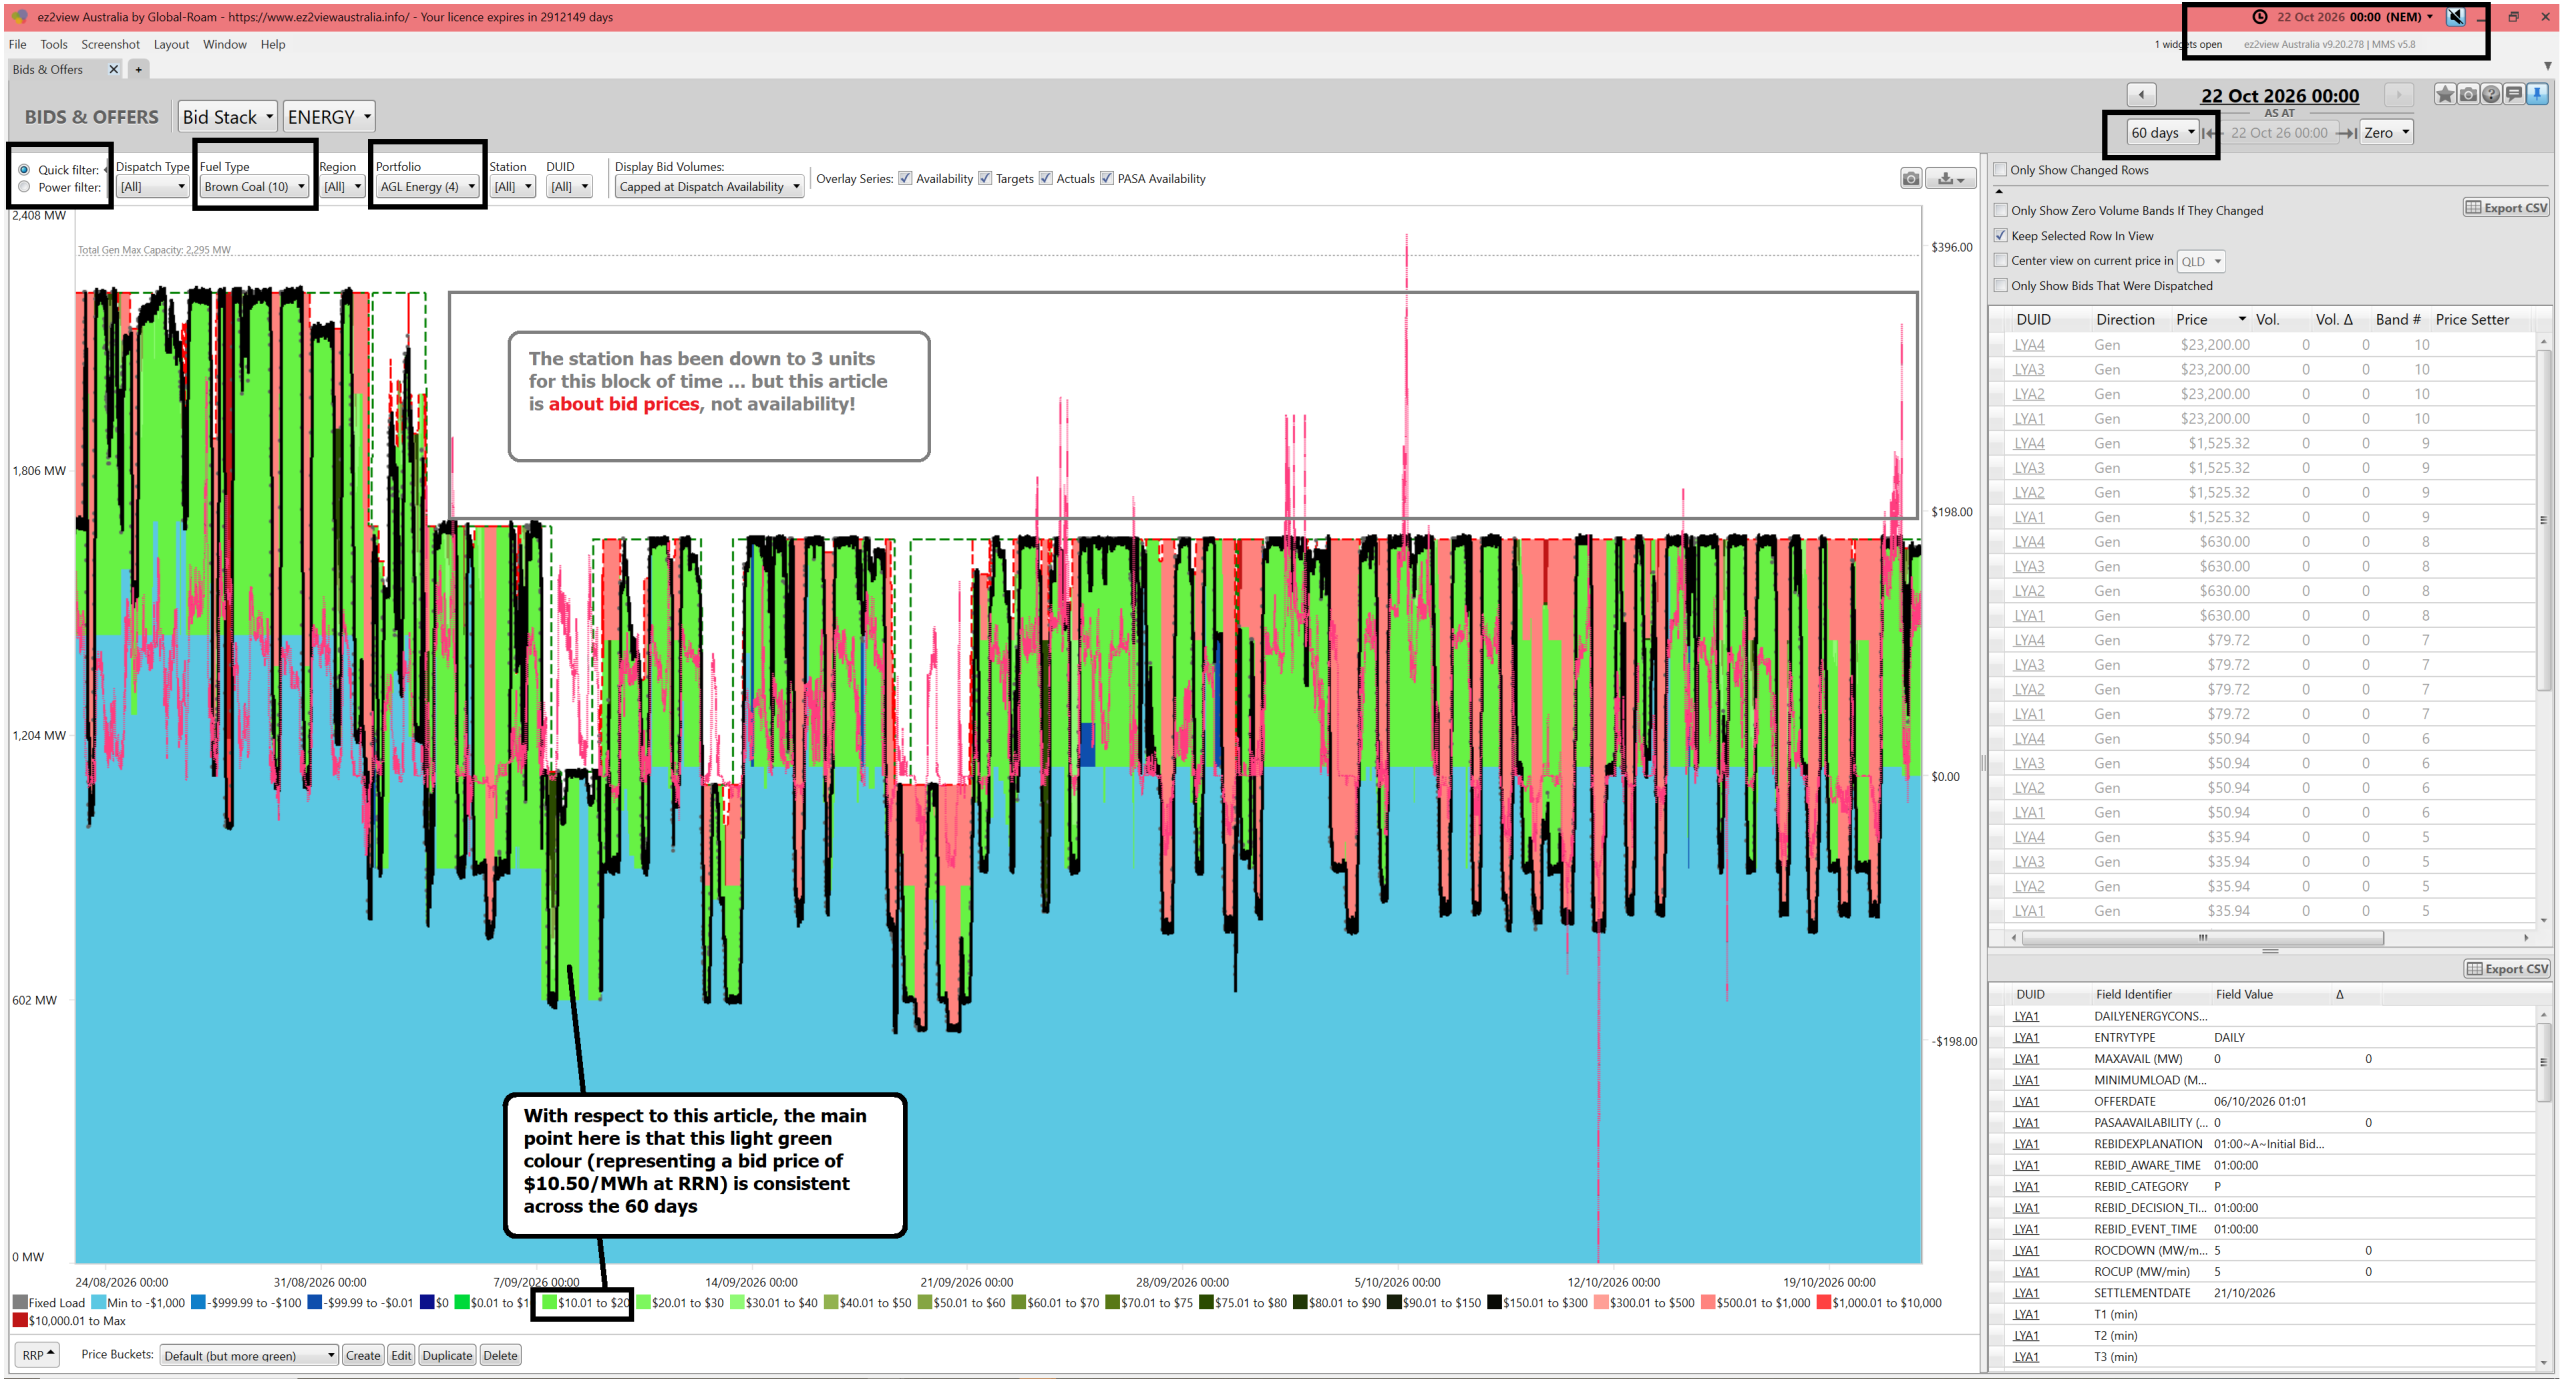
The main points here are:
1) Whilst the station was running with only 3 units since 3rd September 2026:
(a) this exploration is about bid prices, not availability;
(b) so we’ll ignore availability changes in the images below
2) In the case of the Loy Yang A unit:
(a) There’s no discernible change in bid prices between Q3 and Q4
(b) With the SRMC bid price being mostly $10.50/MWh at the RRN.
Alinta Portfolio (Brown Coal units only)
The 2 x Alinta Brown Coal units are Loy Yang B:
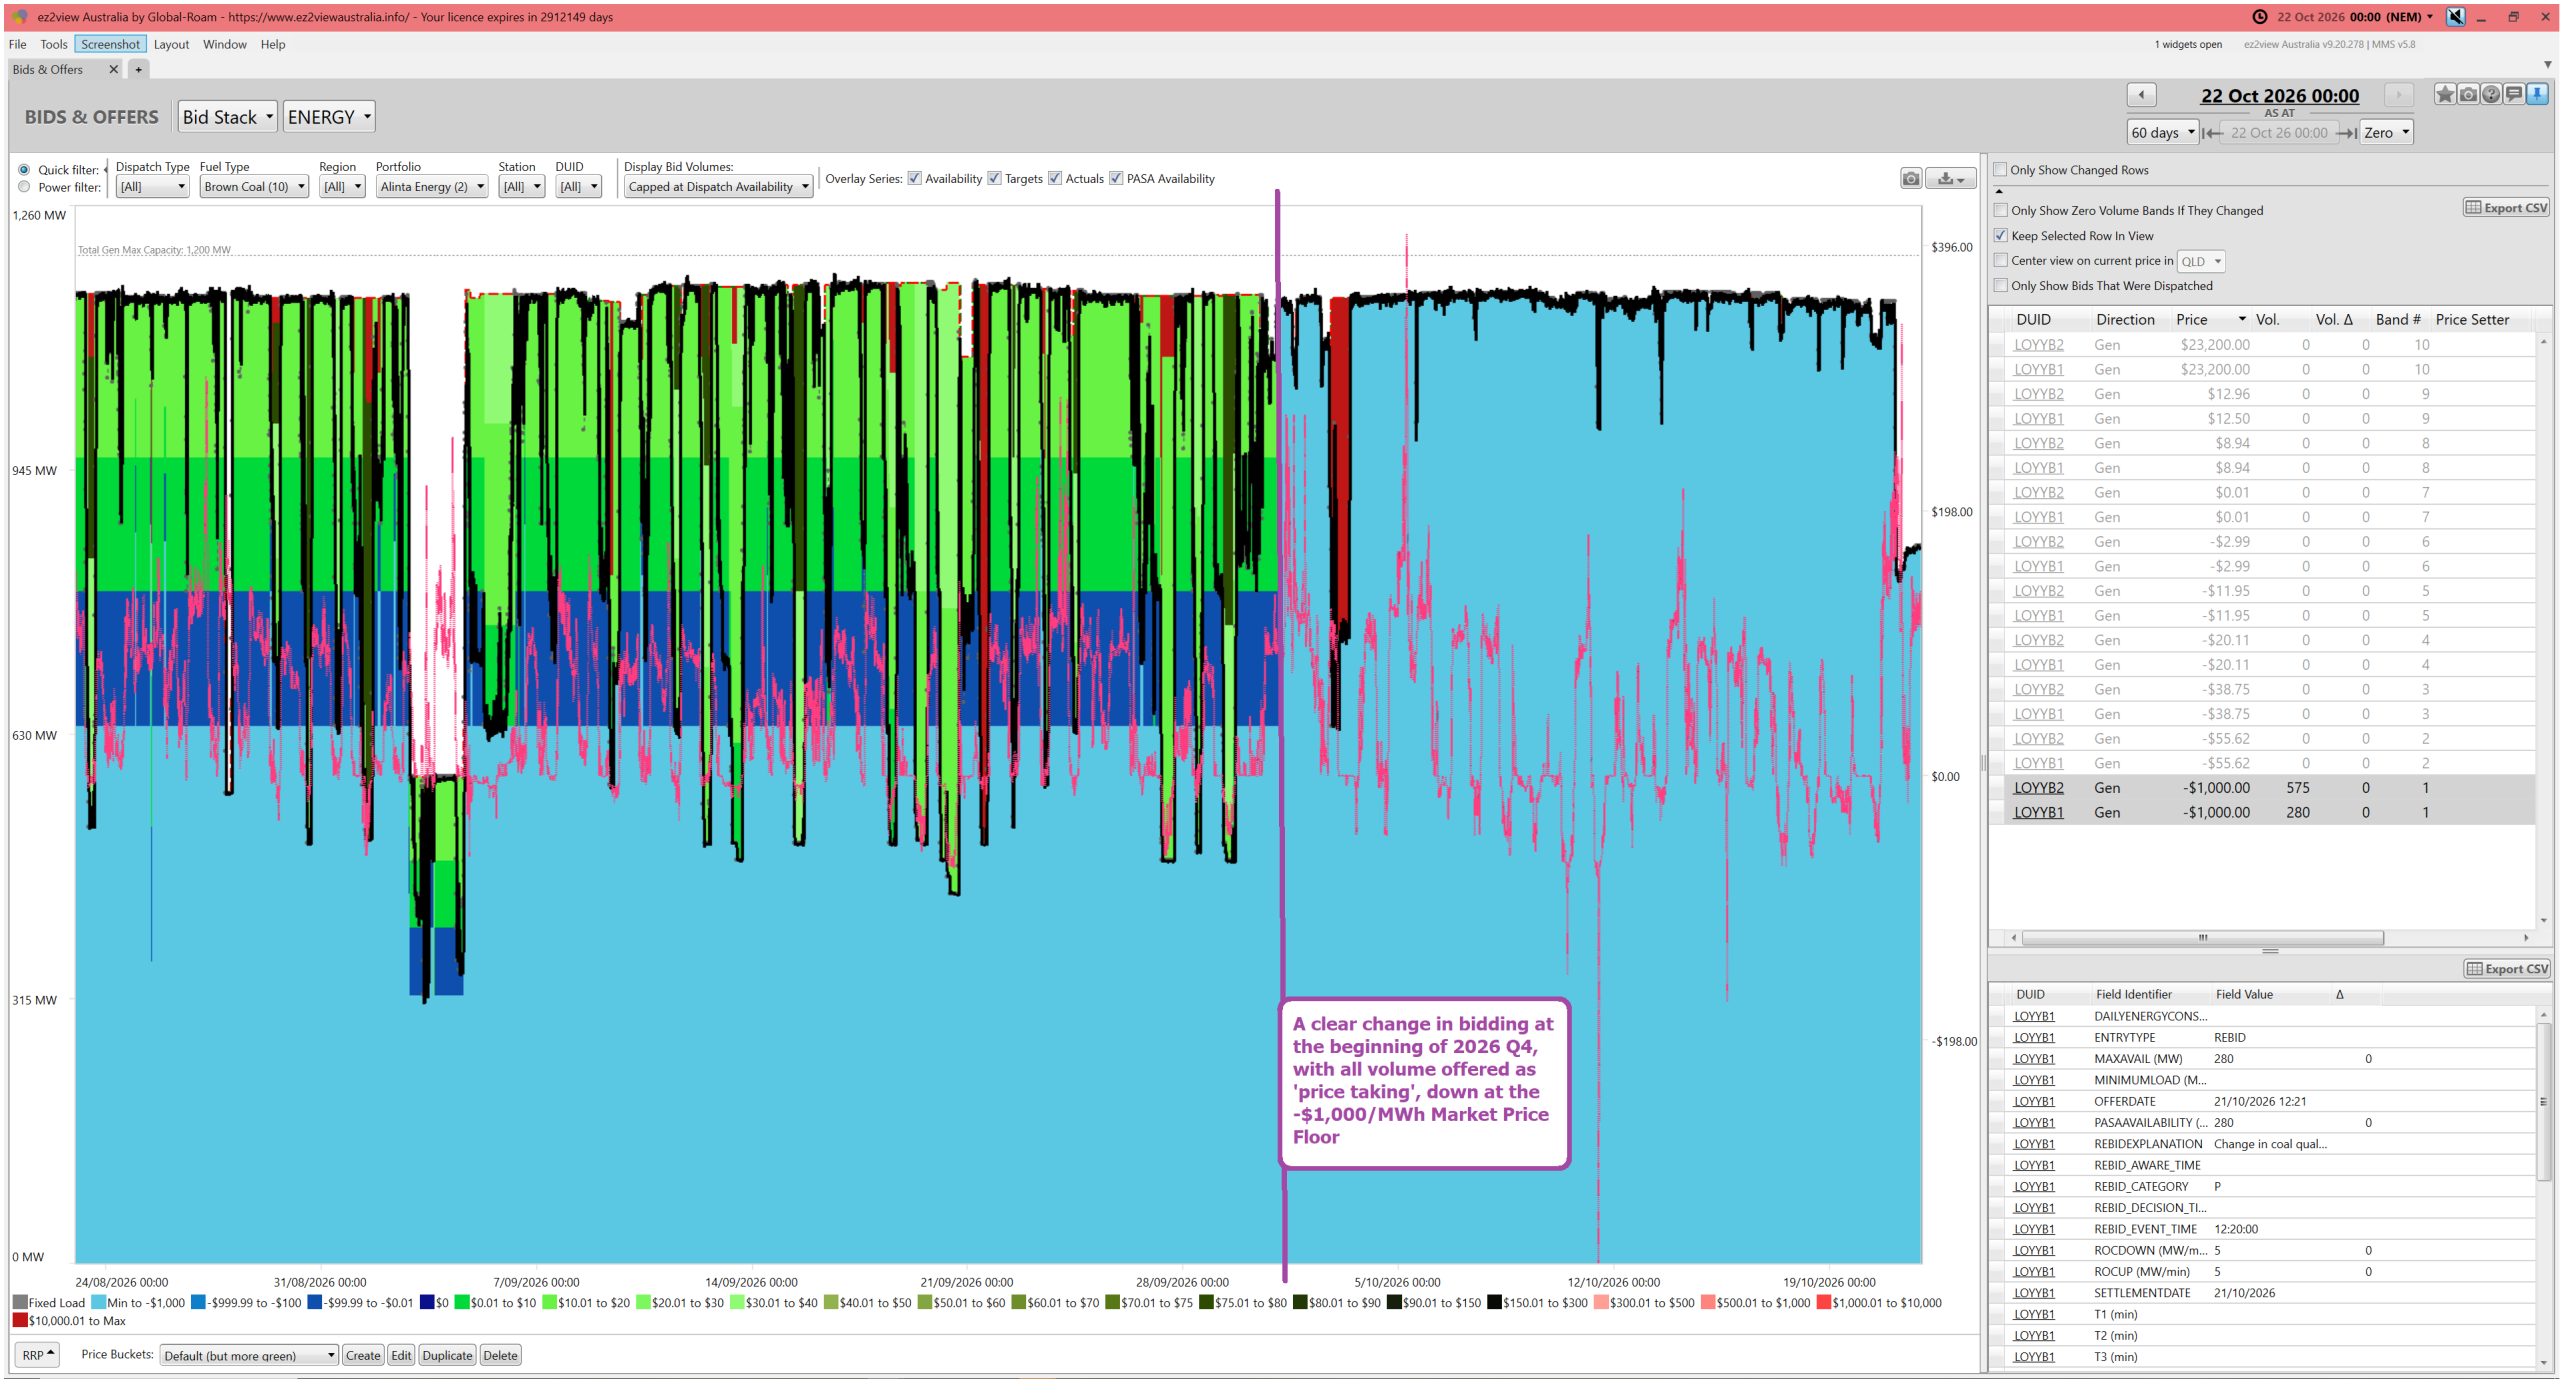
In the case of these two units, a sharp change in bidding occurred at 04:05 on Thursday 1st October 2026 … with all volume shifted down to the –$1,000/MWh Market Price Floor.
EnergyAustralia Portfolio (Brown Coal units only)
The 4 x Yallourn units are next:
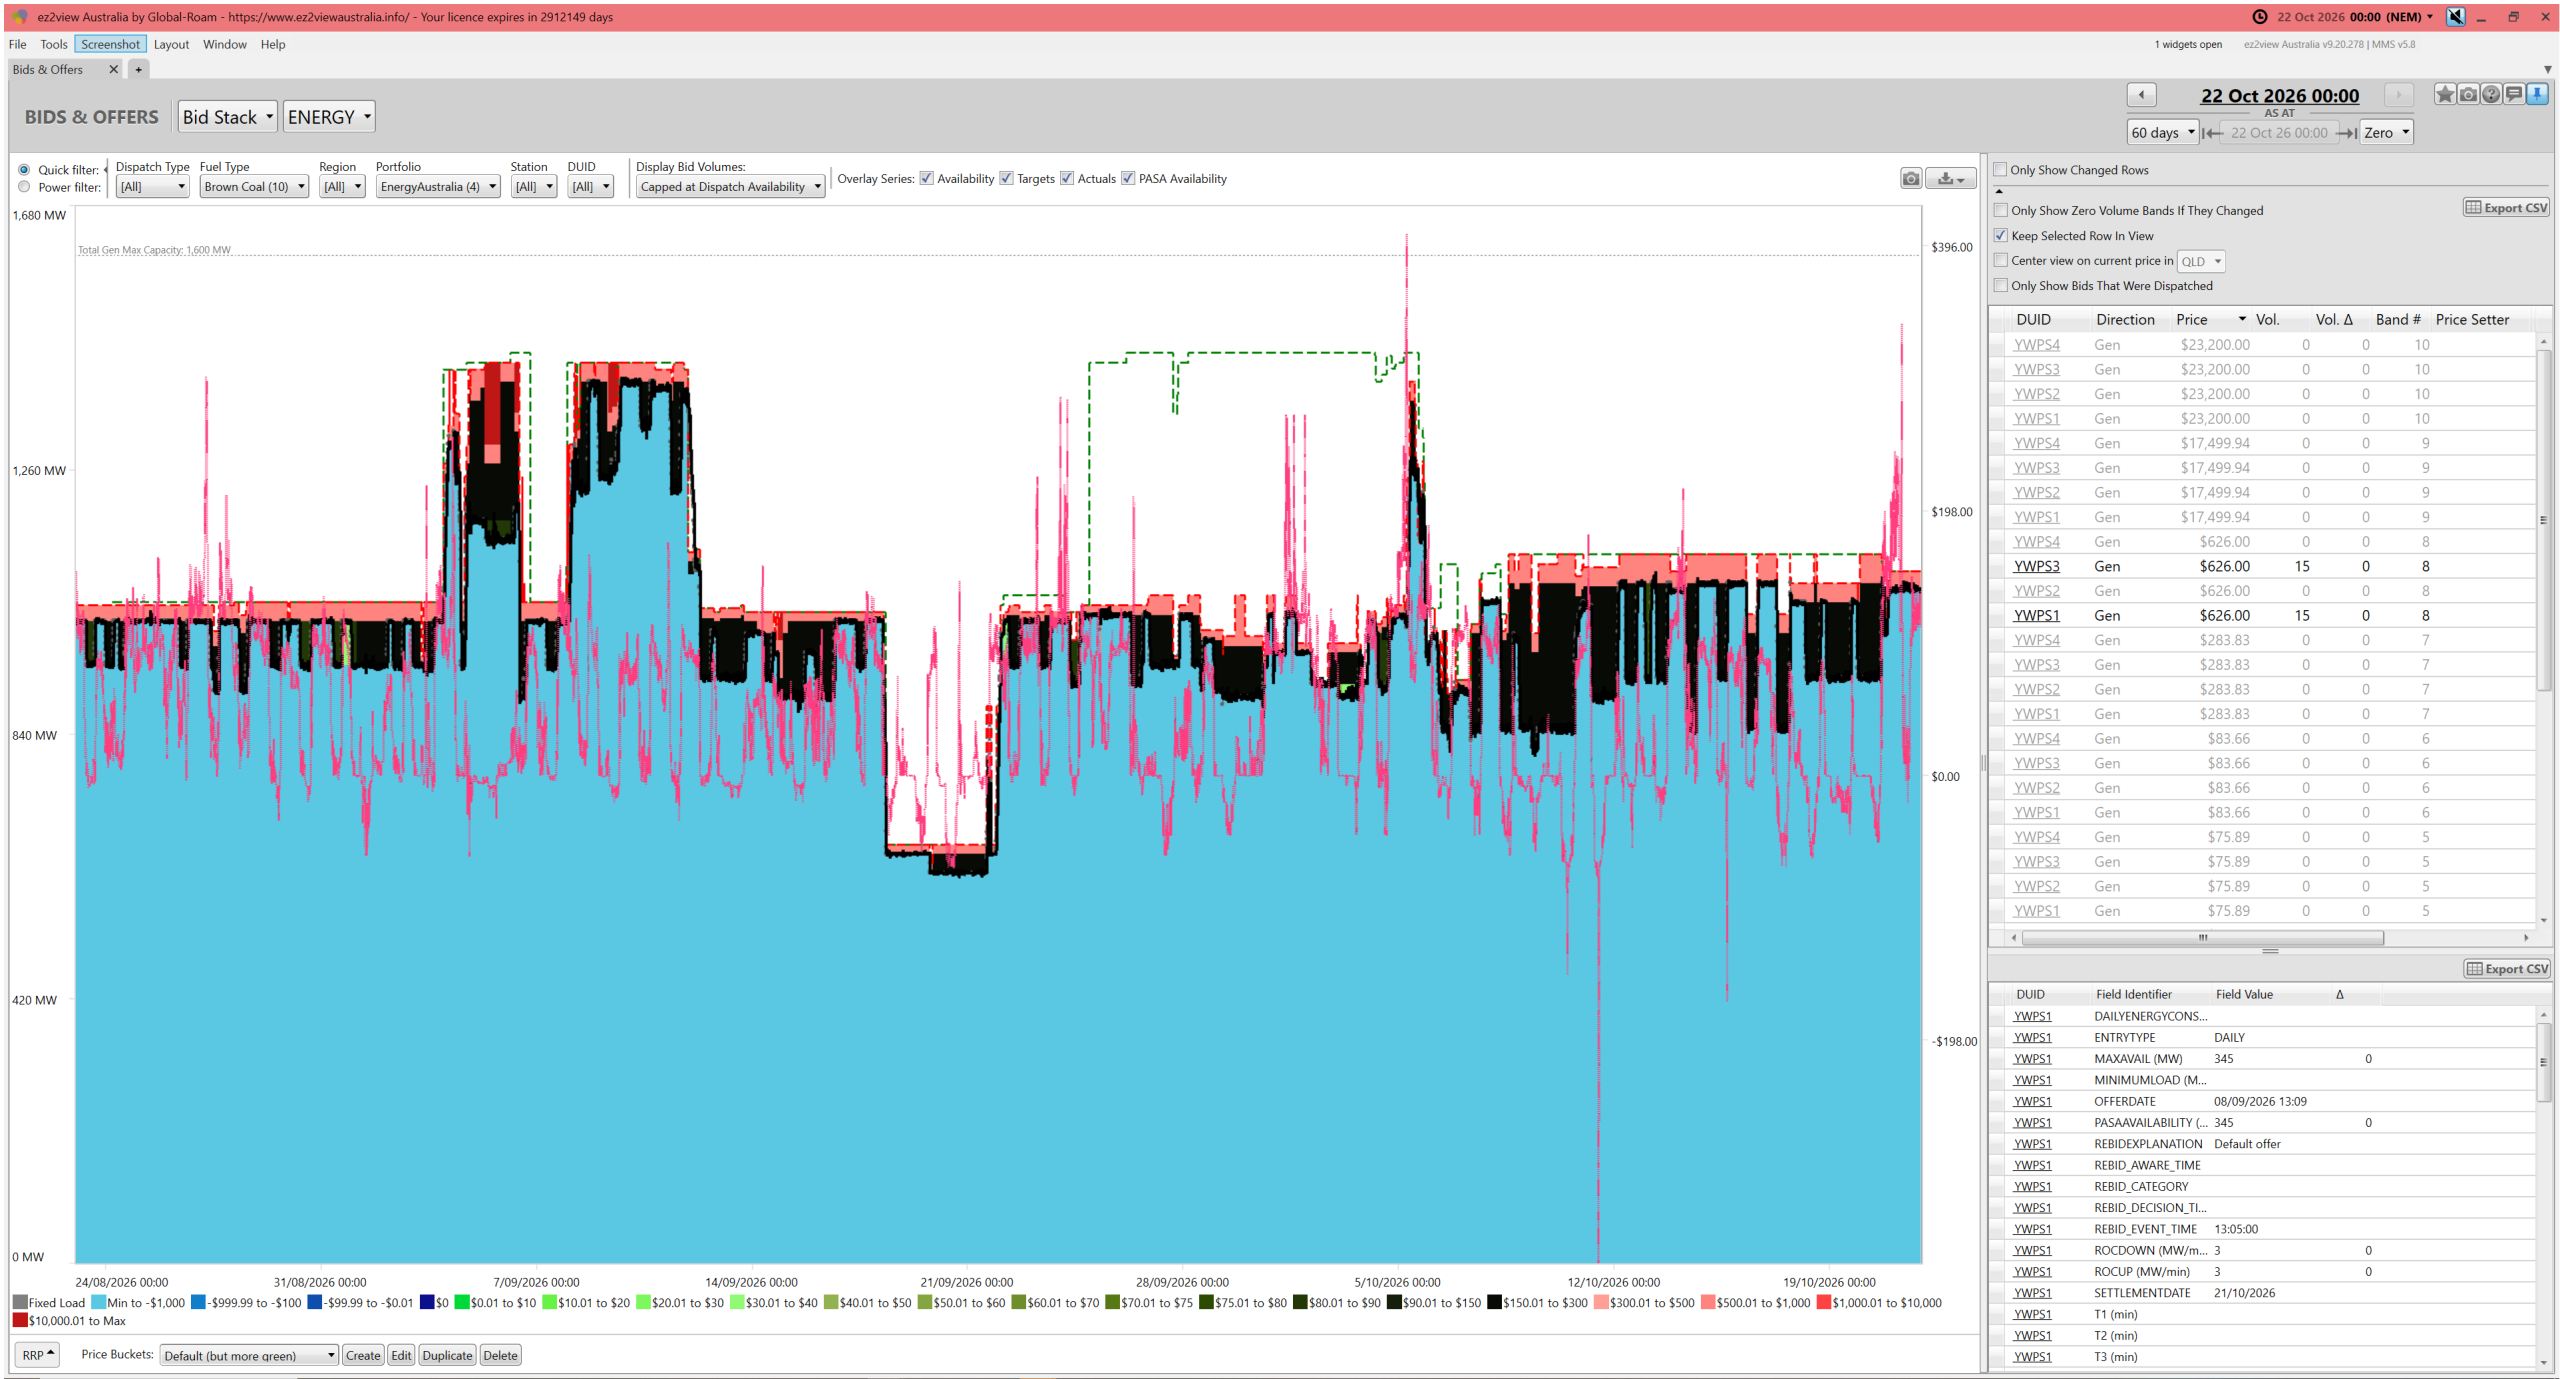
In this case:
1) Regardless of any change in bid price positioning for SRMC bids (of which there were not, at 04:05 on Thursday 1st October 2026);
2) That’s all a moot point anyway, as this snapshot shows (like Loy Yang B above) the Yallourn units are consistently bid as ‘price takers’ (down to the –$1,000/MWh Market Price Floor).
Black Coal units (in NSW and QLD)
We’ll work through these portfolios in alphabetical order:
AGL Portfolio (Black Coal units only)
Returning to AGL but their black coal units (i.e. Bayswater in NSW) we see something quite interesting:
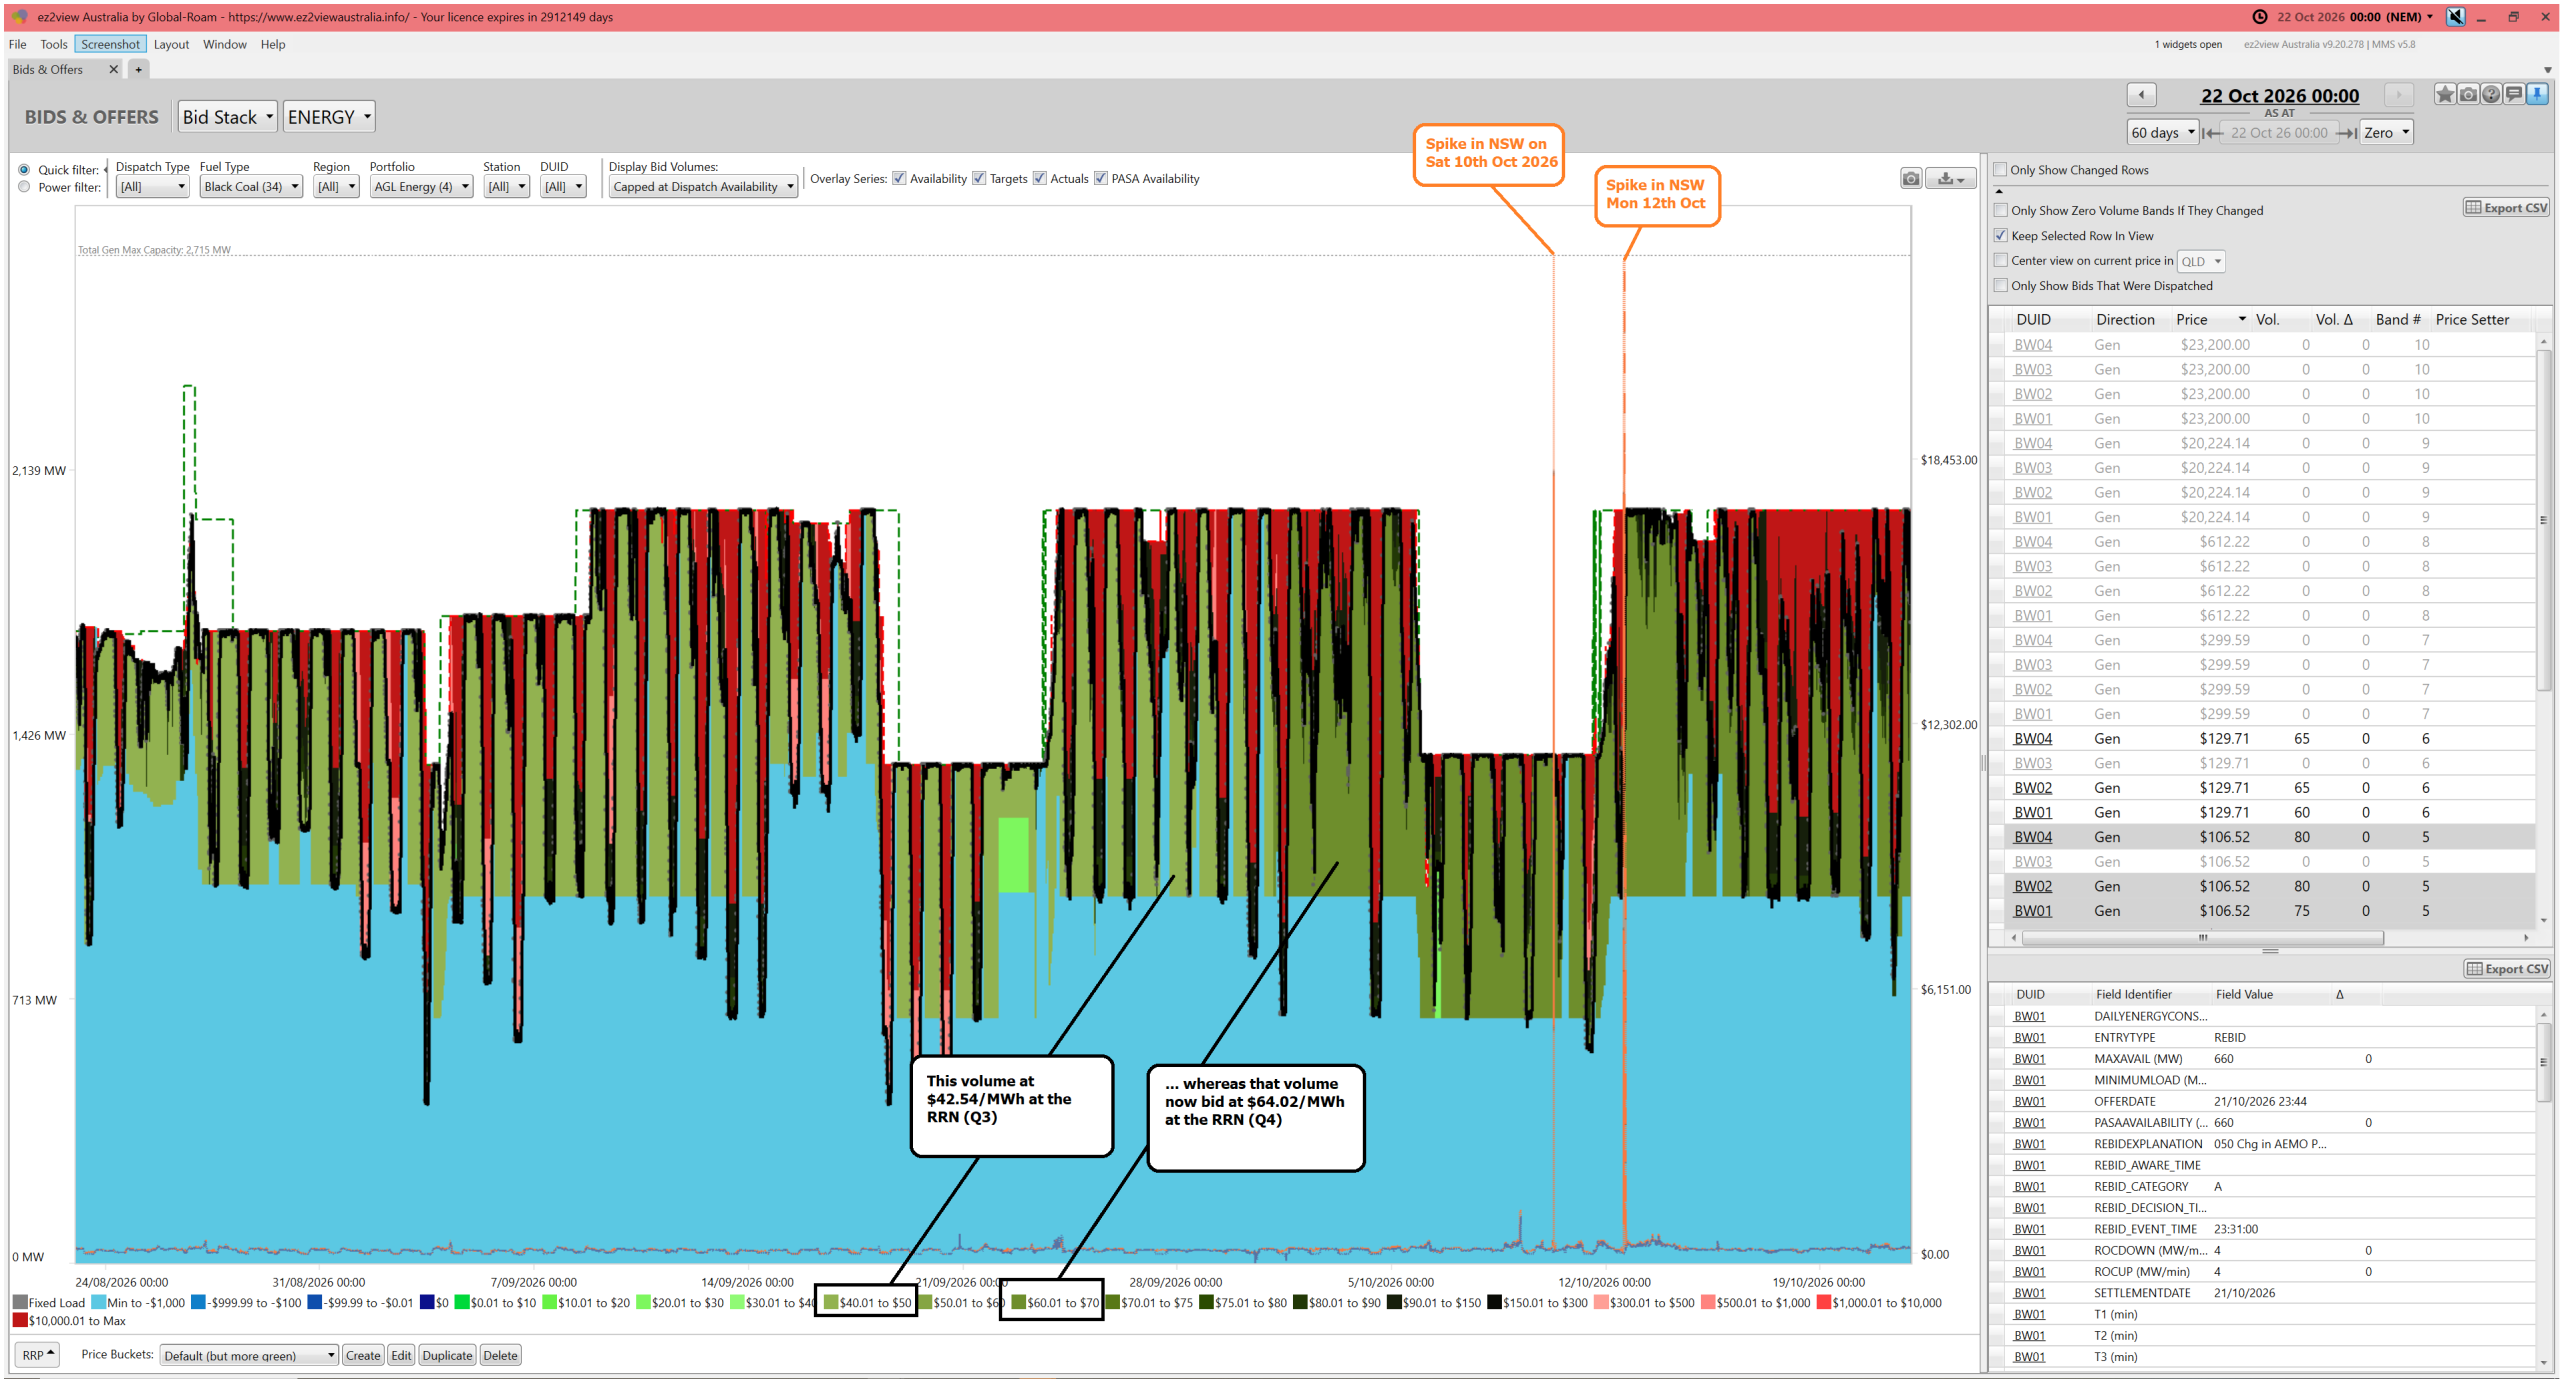
We see:
1) Like for Loy Yang B above, there is also a sharp change in bidding position seen at 04:05 on Thursday 1st October 2026 …
(a) But in this case we see SRMC bid prices have gone up notably;
(b) Remembering that there are 10 bands in a unit, the change I particularly want to highlight is in the more granular ‘green’ colouring:
i. From $42.54/MWh at the RRN in Q3;
ii. To $62.05/MWh at the RRN in Q4;
iii. Which is a step up of $19.51/MWh.
2) This is for reasons not explored at this time:
(a) It might be for changes in coal contract prices;
(b) Or the availability of volumes
(c) Or for other reasons
(d) But (conspiracy theorists be clear) I’m certainly not suggesting anything untoward, or against the rules, is happening!
3) I am, however, flagging this as one change that is quite likely to have flowed through to the futures price uplift.
Separately, those who want to look particularly at the periods of volatility in NSW on Saturday 10th October 2026, and Monday 12th October 2026 can see the bids in context of those spikes.
Callide Power Trading Portfolio (Black Coal units only)
Next in alphabetical order is the Callide Power Trading portfolio … which are the two units at Callide C.
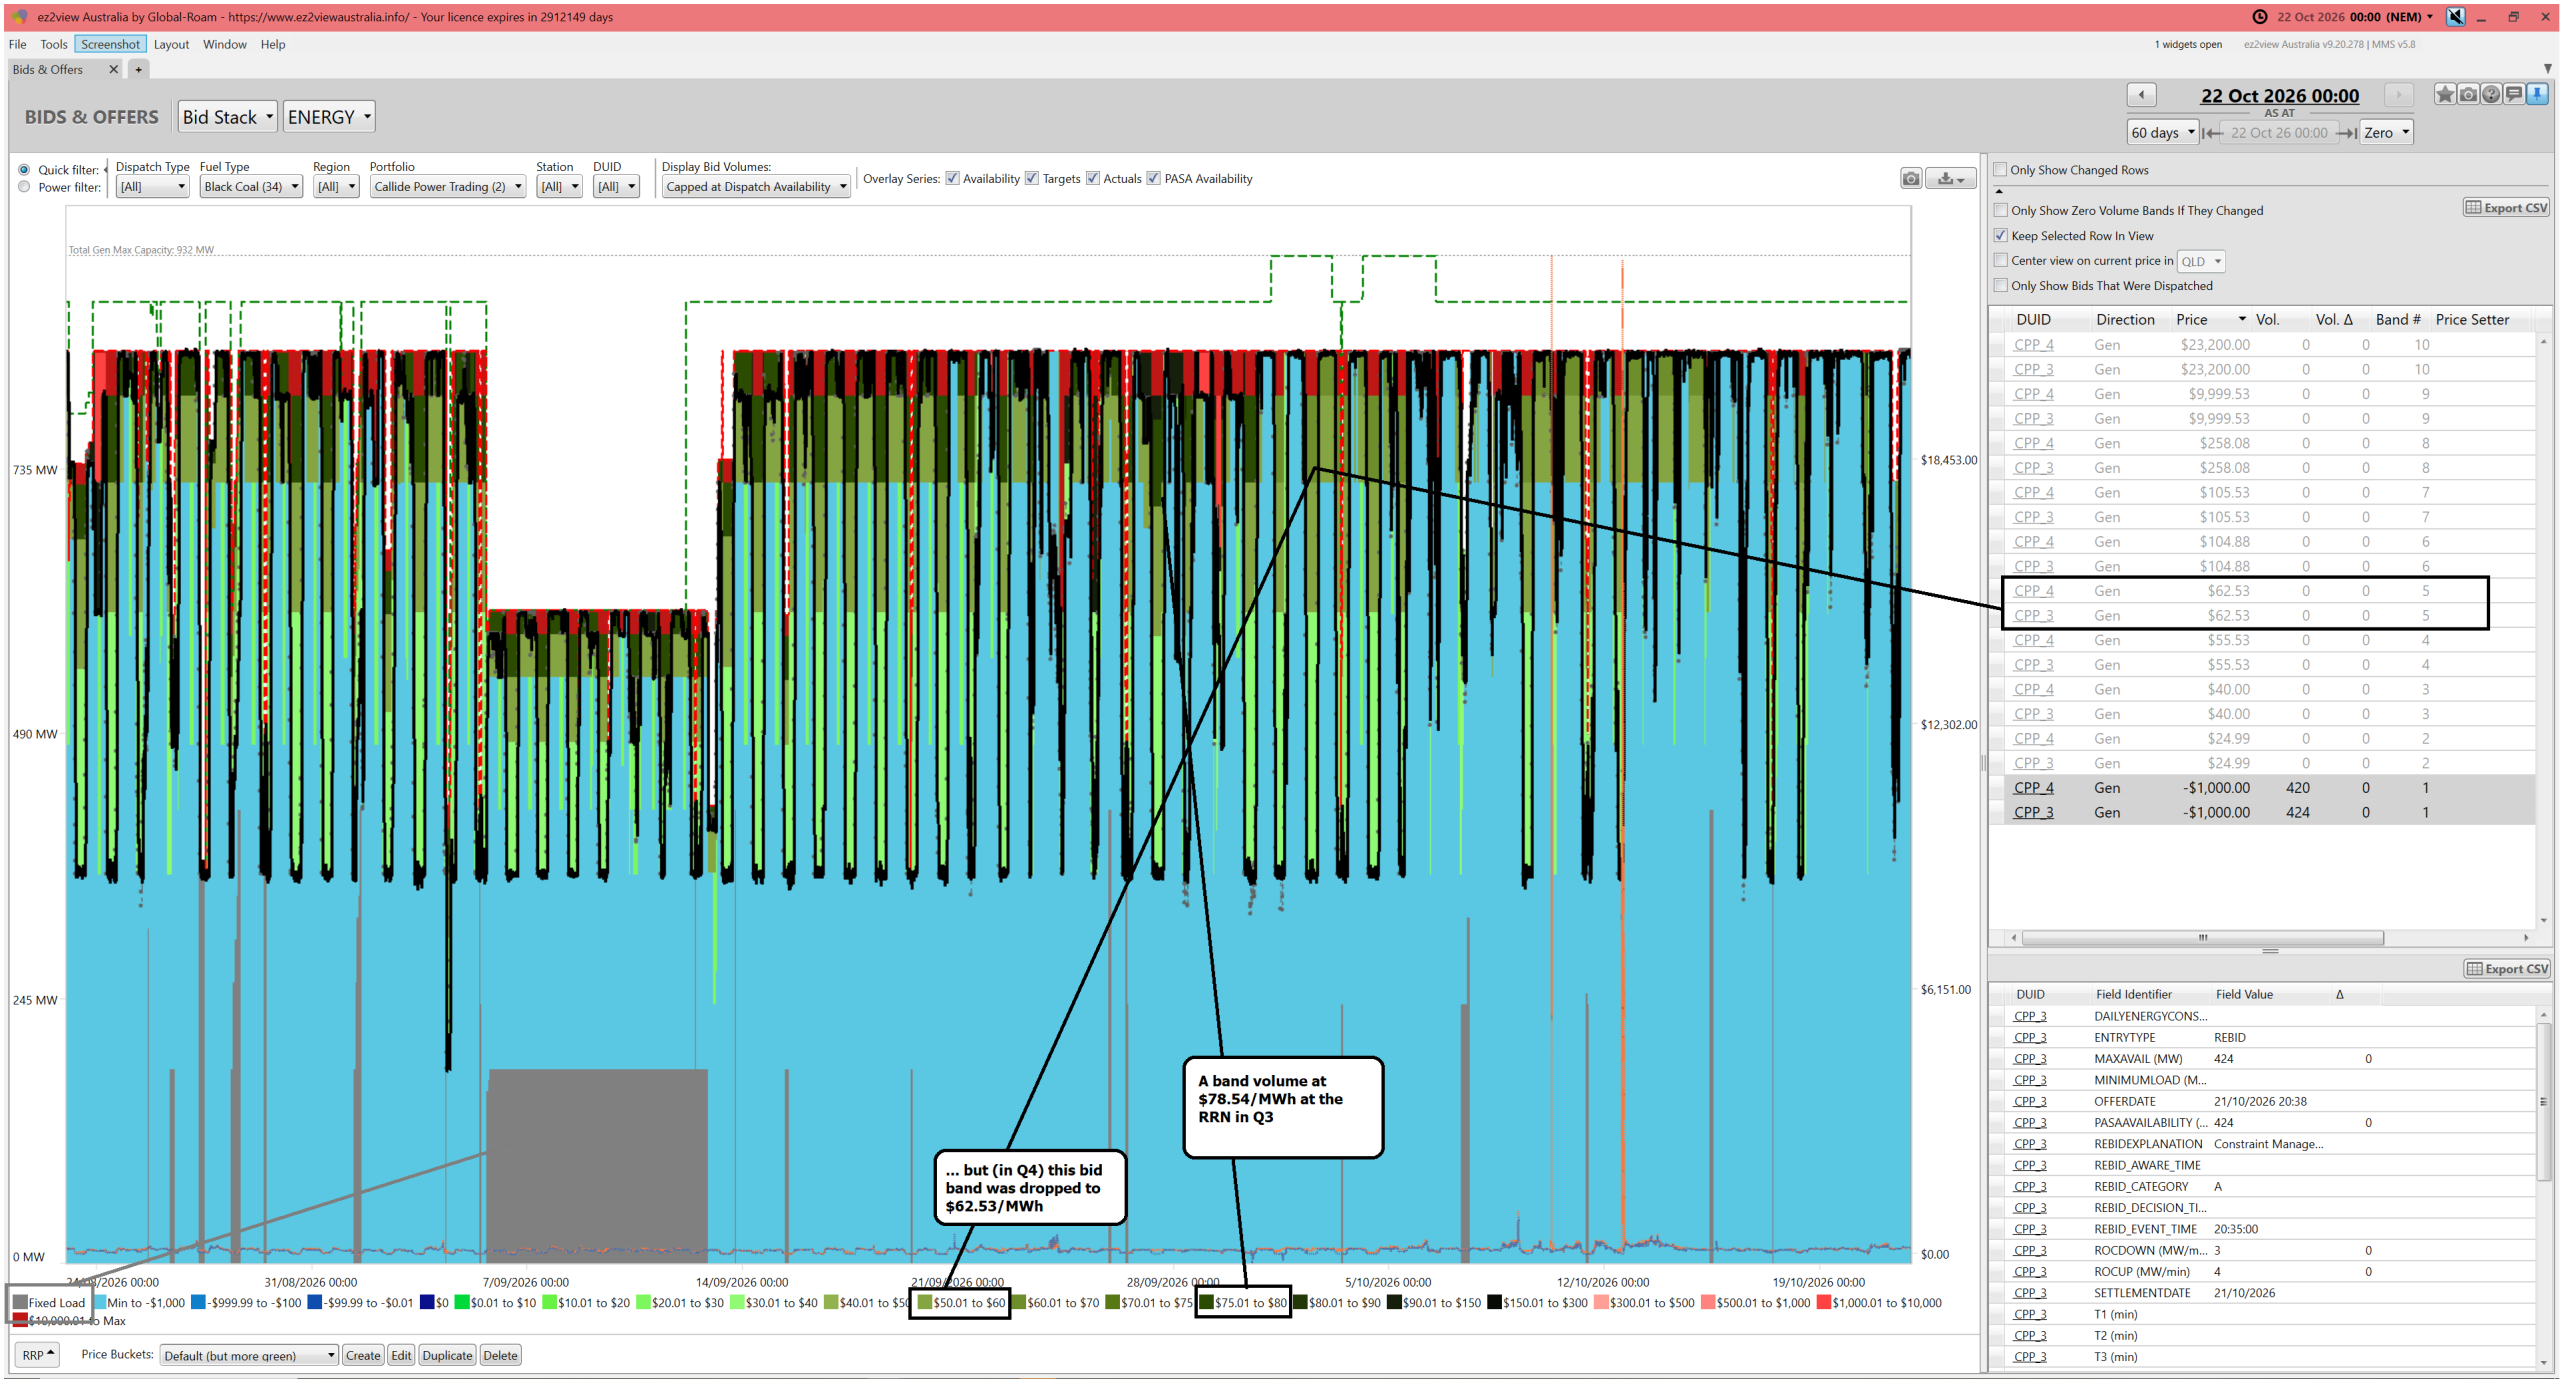
As per the annotation, the more finer-grained colouring allows the user to see:
1) that bid band 5 saw a price drop from Q3 ($78.54/MWh at the RRN) to Q4 ($62.53/MWh at the RRN)
2) sometimes volume was allocated there in the bid
3) and, over the time range shown (in both Q3 and Q4), it was quite frequently dispatched
CS Energy Portfolio (Black Coal units only)
Next in alphabetical order is the CS Energy portfolio:
1) these are the two units at Callide B, the 6 units at Gladstone and Kogan Creek
2) so a diverse bunch of units – in several dimensions (age, location, coal supply arrangements, quality and costs plus more)
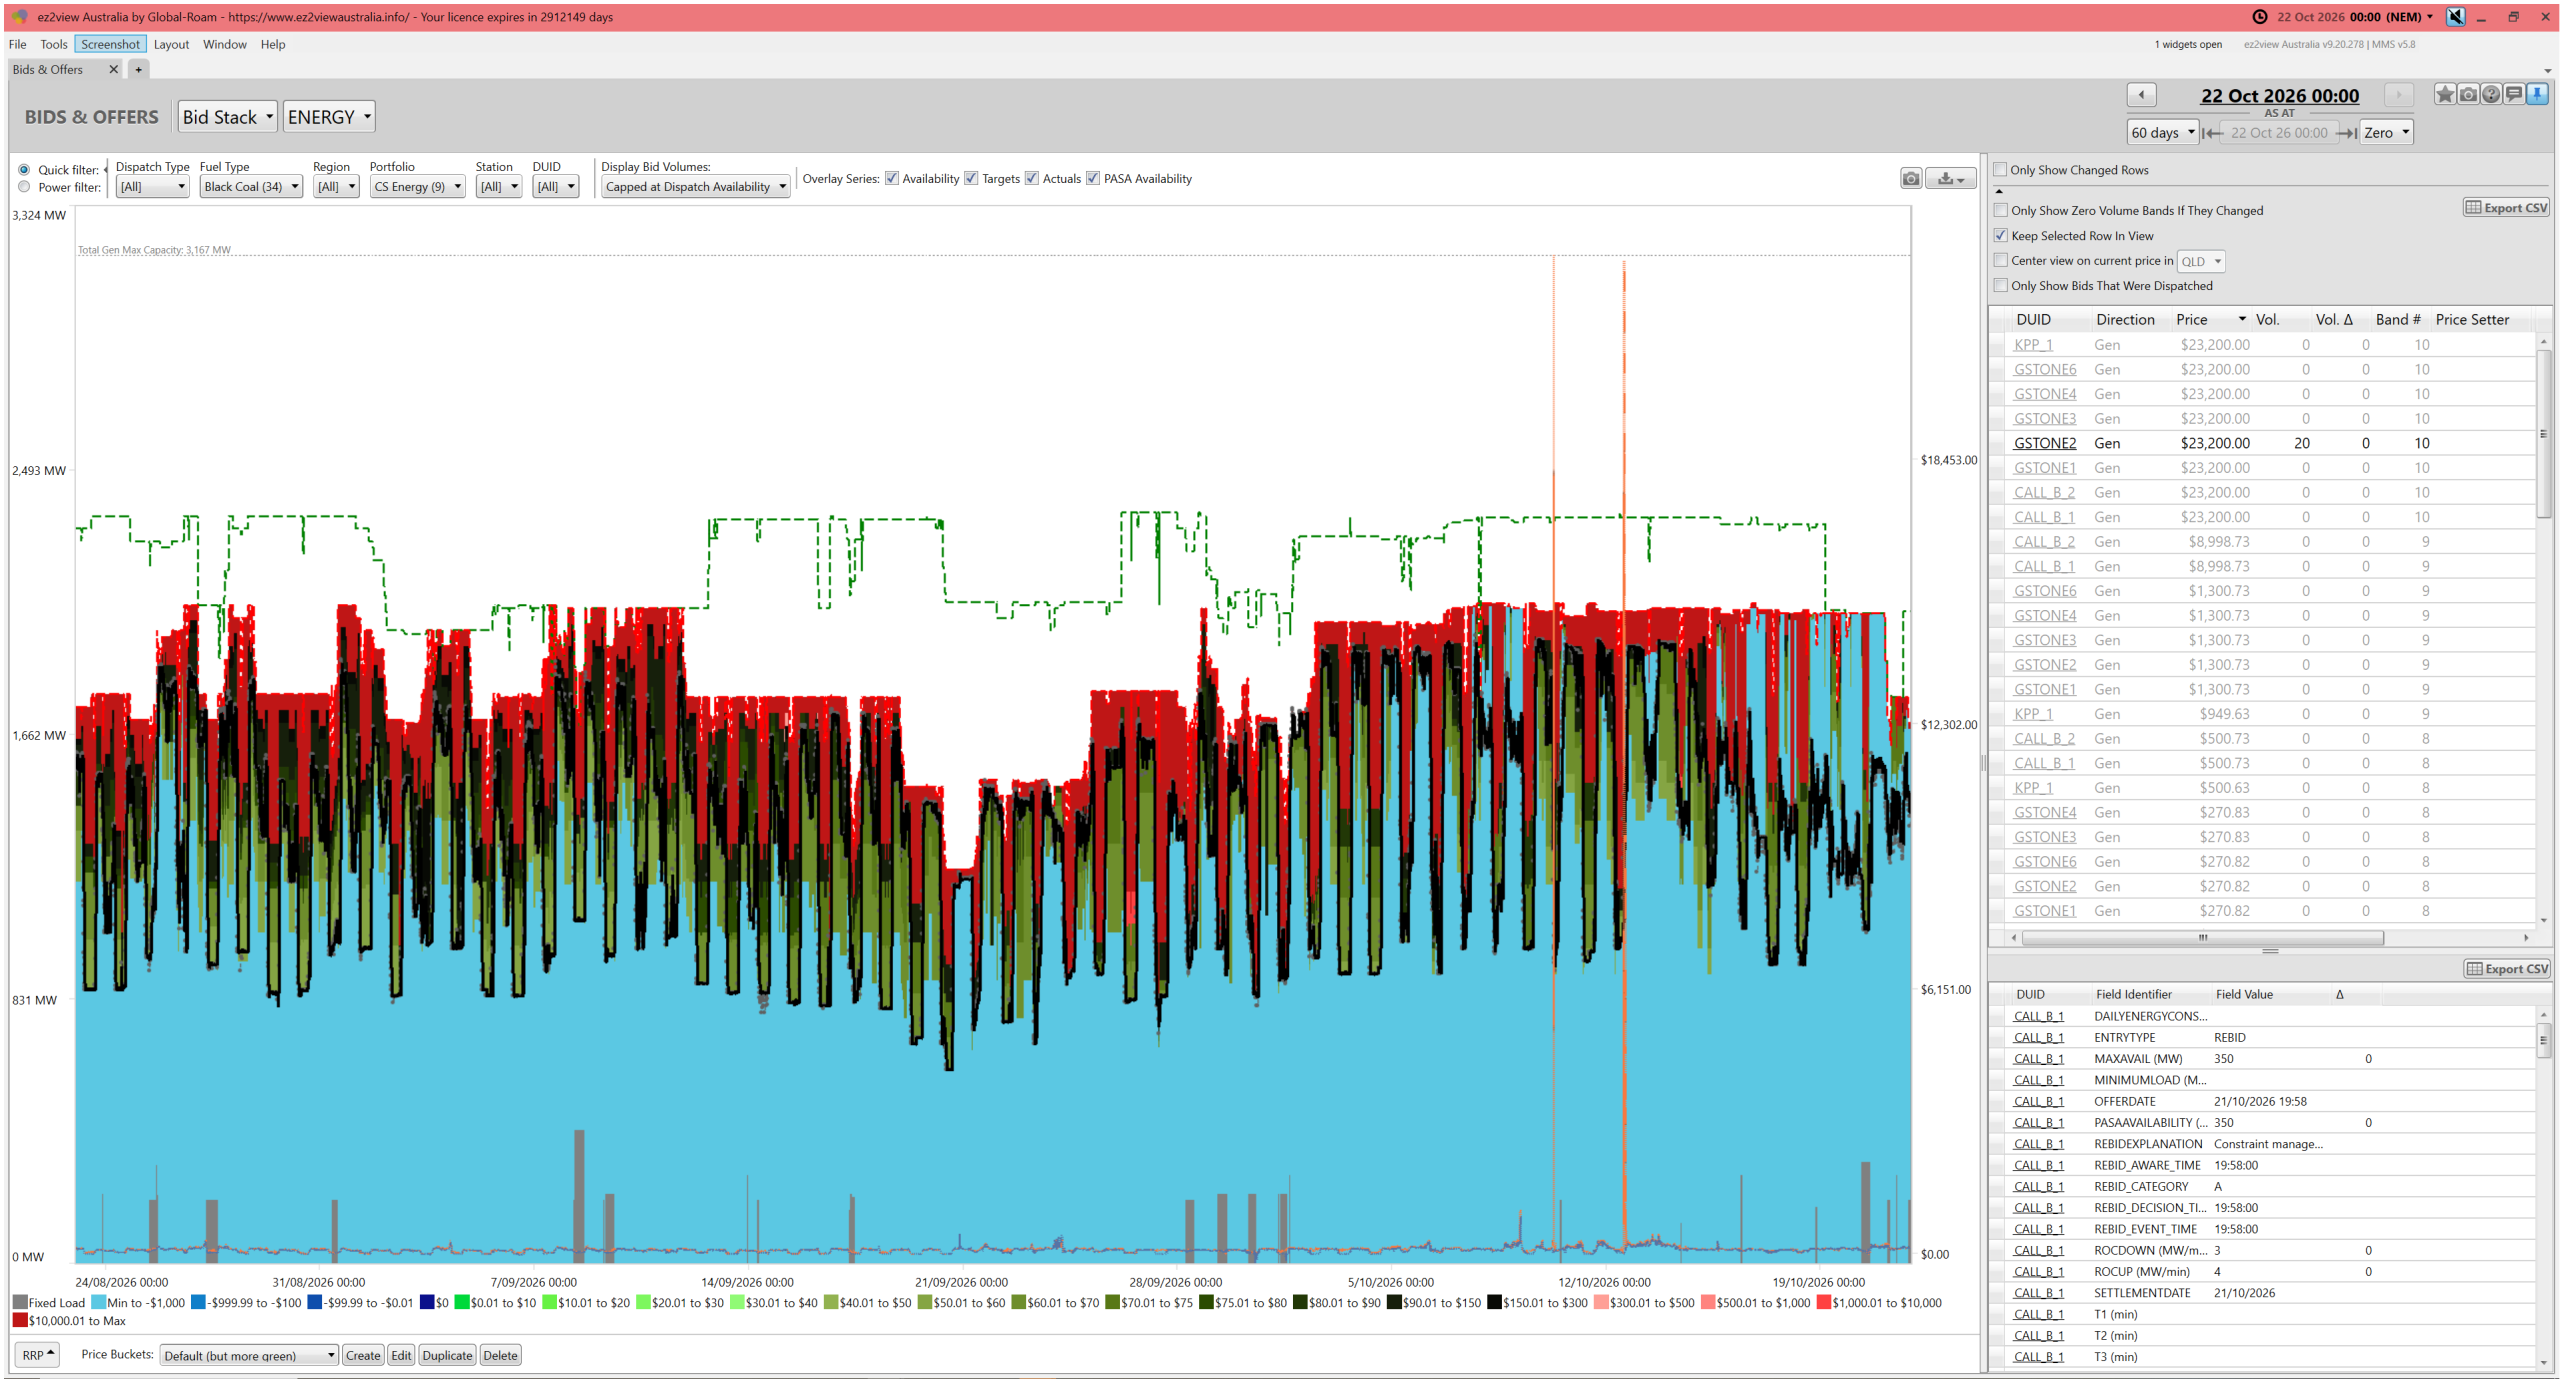
This trend of bid stacks for 9 units (so 90 bid bands) is way too busy to annotate – so understand that:
1) There are some subtle adjustments to ‘green’ bid prices over this time range;
2) But the reader can see, from the broad colour patterns, that the larger change has just been a progressive increase in volume down to the –$1,000/MWh Market Price Floor.
EnergyAustralia Portfolio (Black Coal units only)
Next in alphabetical order are the 2 x Mt Piper units in NSW (and readers might like to remember the EnergyAustralia units in VIC above):
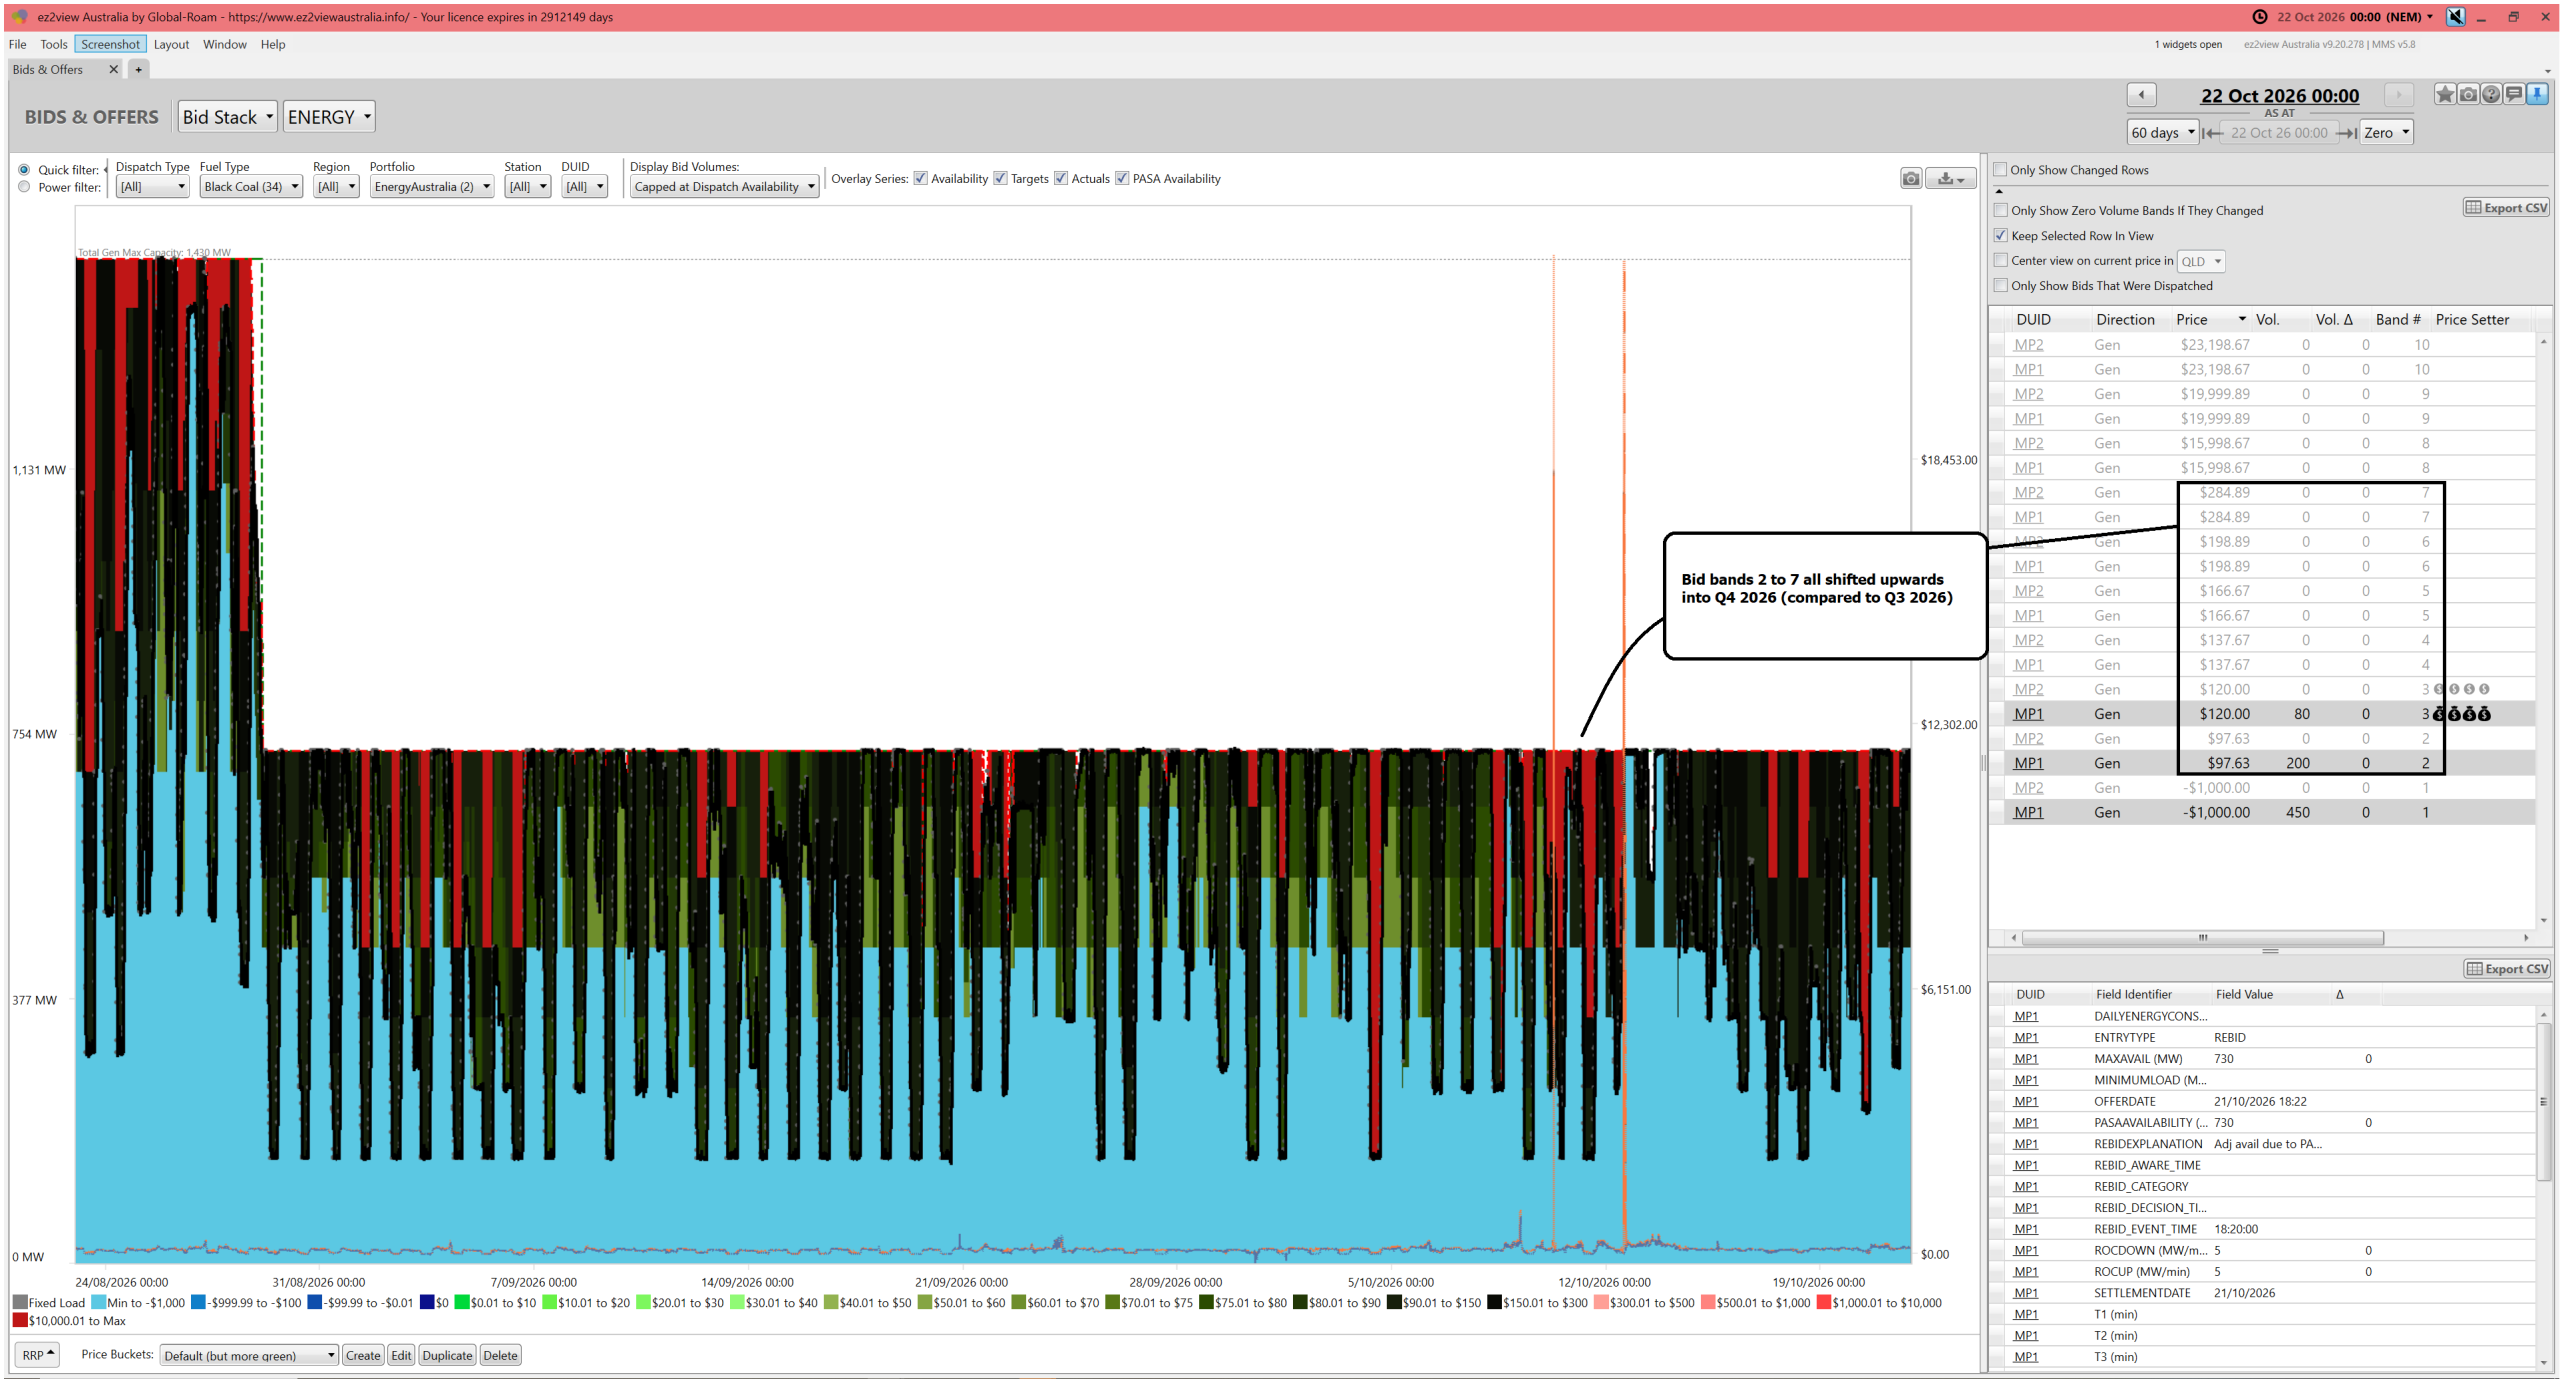
As per the annotation, bid bands 2 to 7 all shifted upwards moving from 2026 Q3 to 2026 Q4.
Genuity Portfolio (Black Coal units only)
Next in alphabetical order are the two Millmerran units:
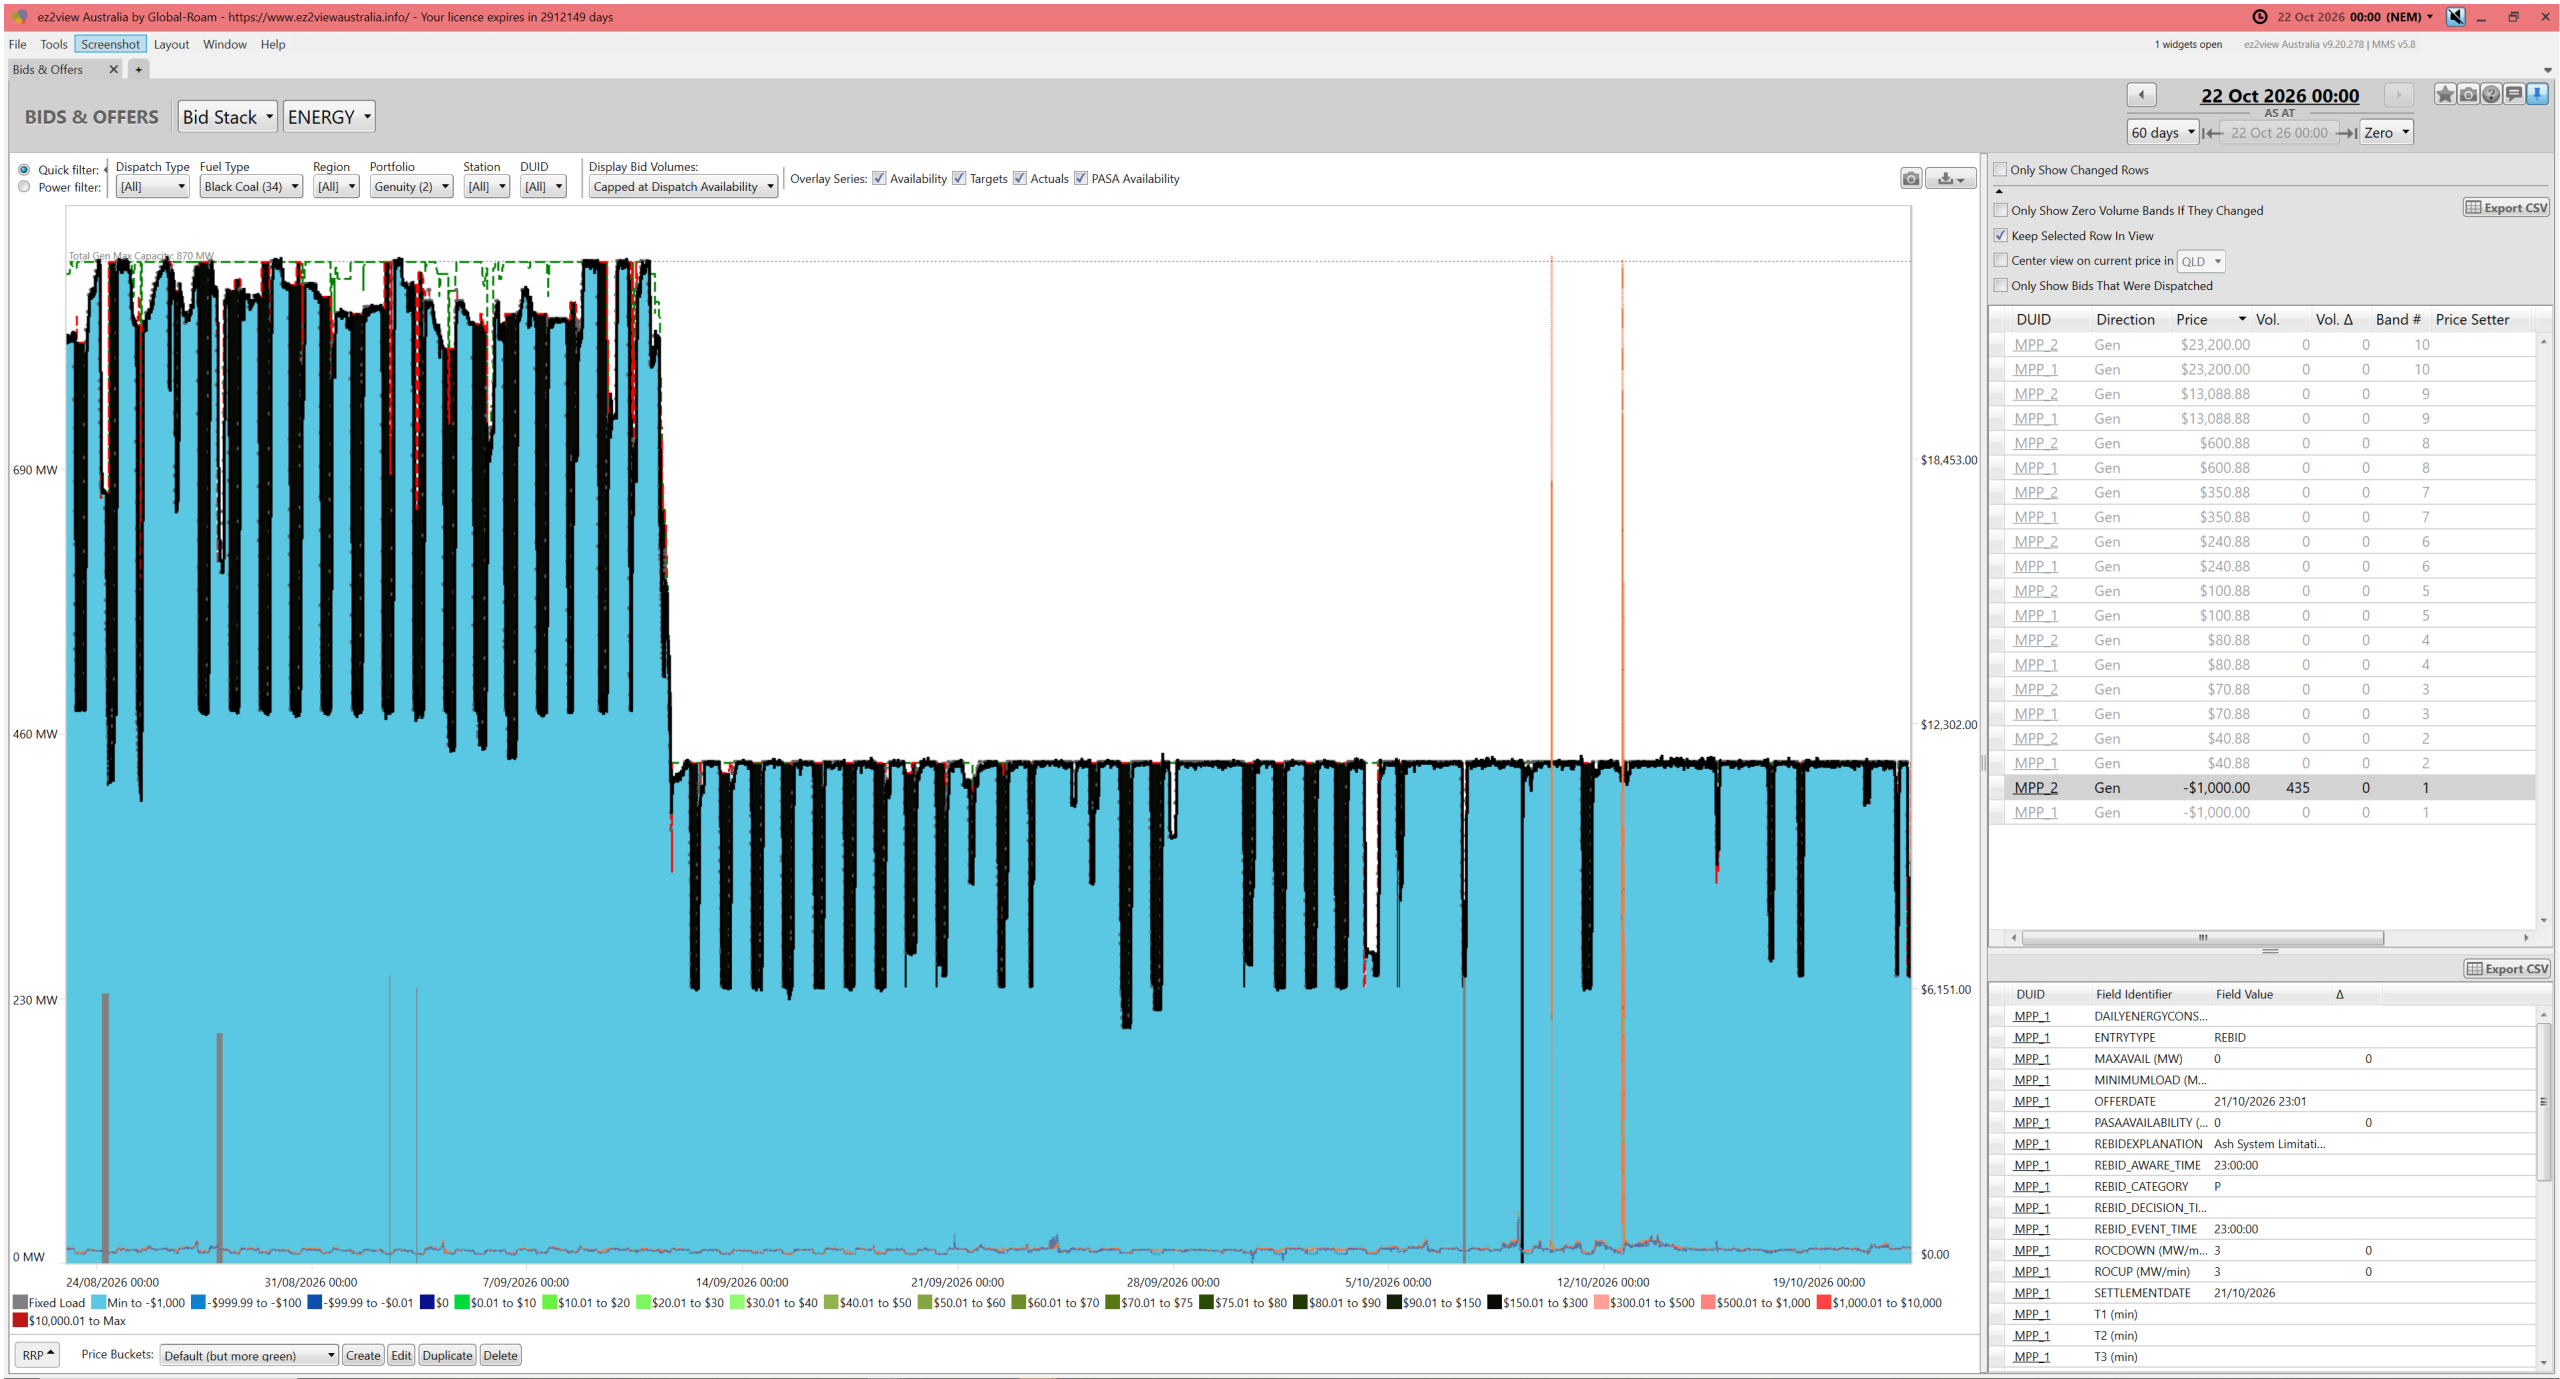
Whilst checking for completeness that there were no adjustments to bid price bands between Q3 and Q4 (there were none), it’s all a moot point anyway as almost all volumes in this range are down at the –$1,000/MWh Market Price Floor.
Origin Energy Portfolio (Black Coal units only)
Next in alphabetical order are the 4 x Eraring units:
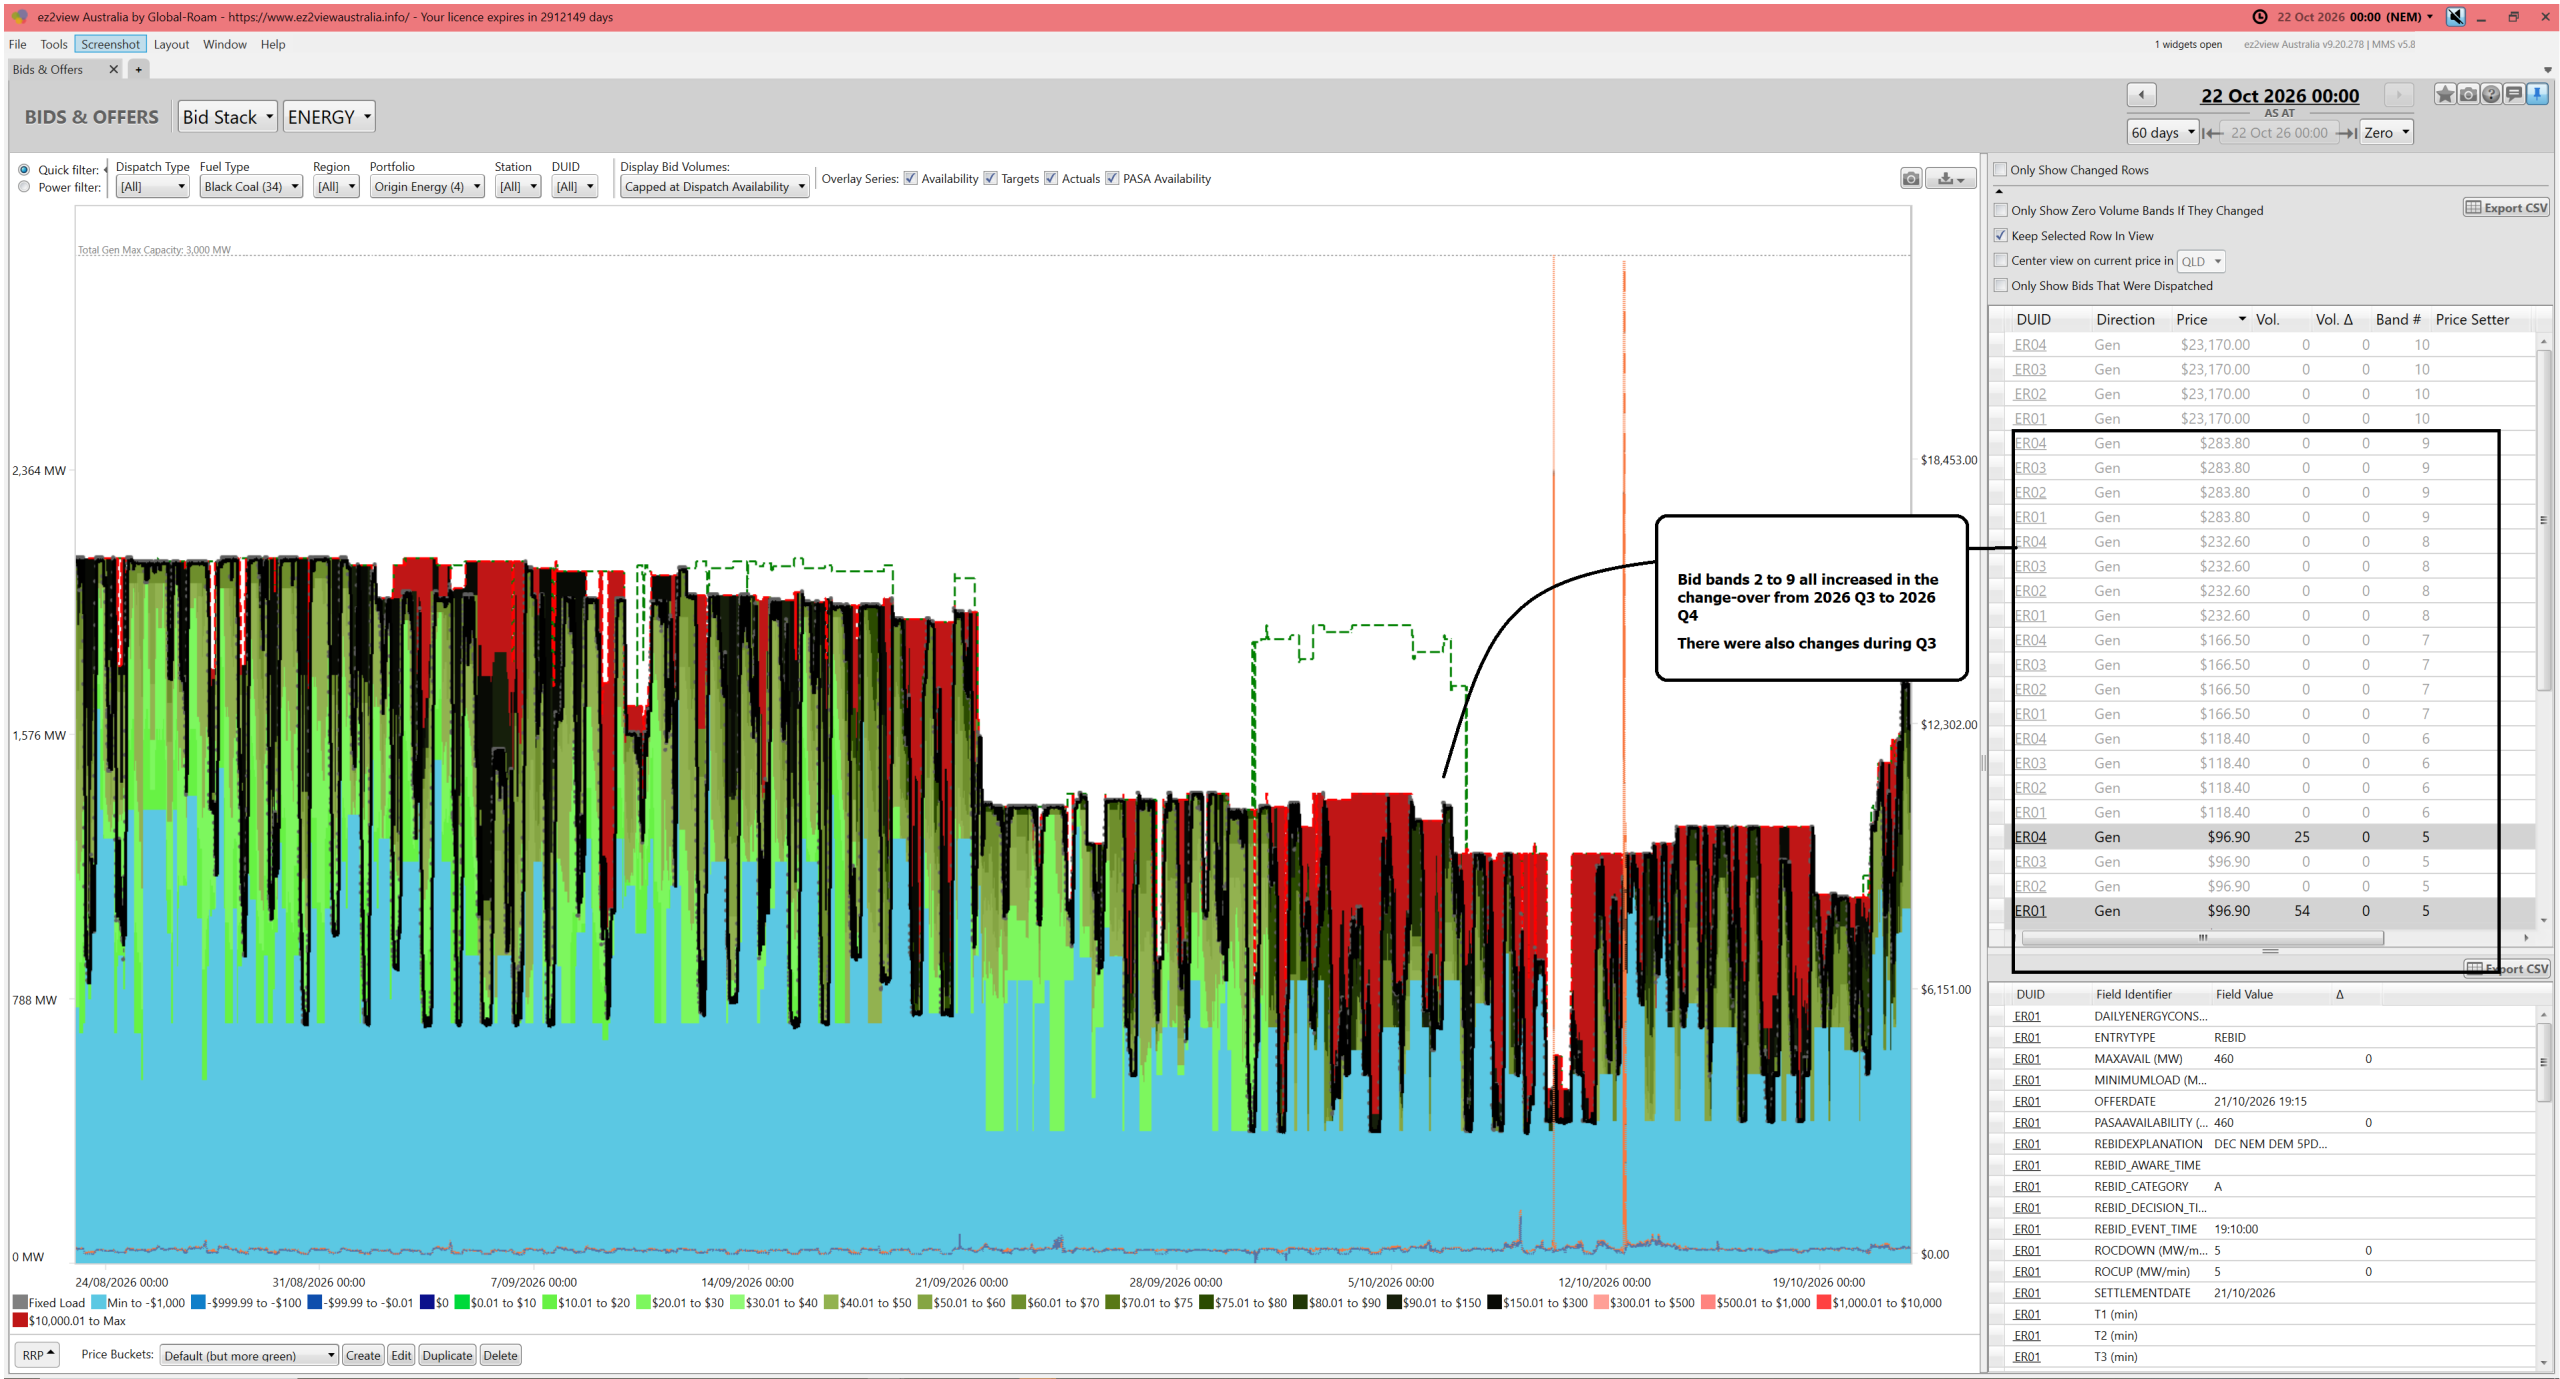
With a reminder that we’re not speaking about availability here:
1) There were changes from bid bands 2 to 9 from 2026 Q3 (increased) to 2026 Q4;
2) Which is similar to some other NSW portfolios;
3) And also I see several changes through Q3.
Sev.En Portfolio (Black Coal units only)
Next in alphabetical order is the Sev.En Energy (i.e. Delta) portfolio … which are the two units at Vales Point.
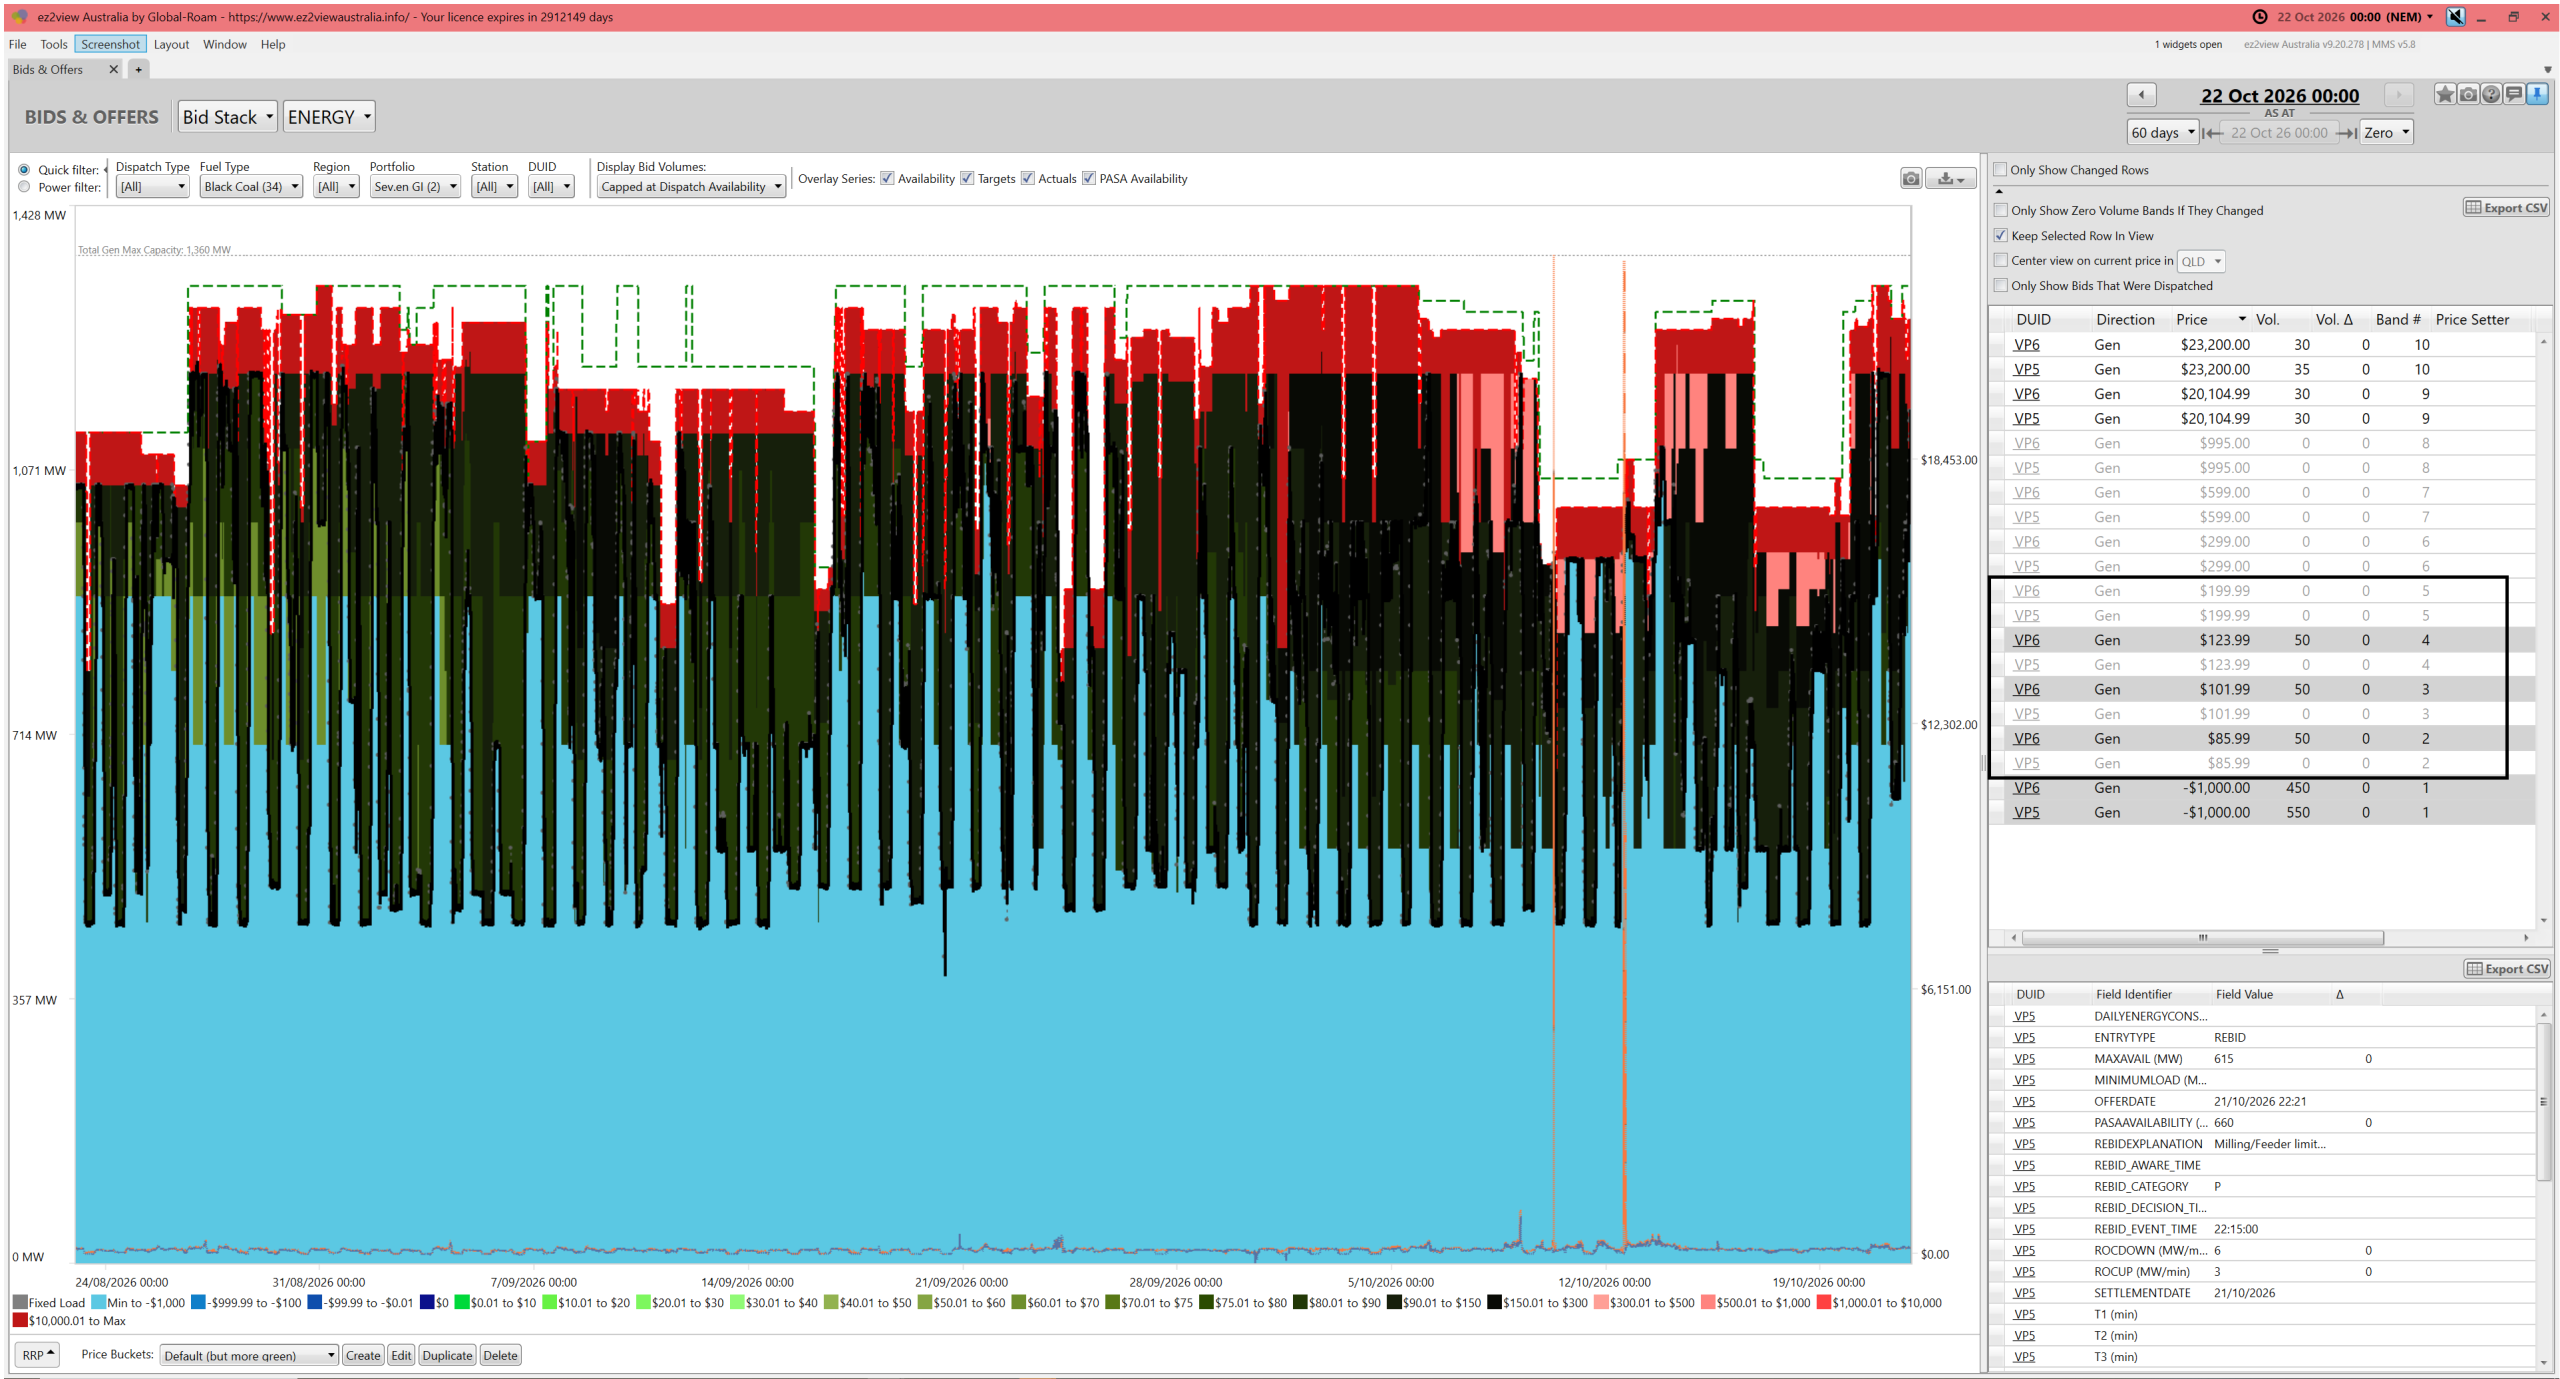
A quick scan says:
1) There were changes in bid prices for bands 2 to 5
2) But these were not focused on the Q3 to Q4 transition.
Stanwell Portfolio (Black Coal units only)
Next in alphabetical order is the Stanwell portfolio … which are the 4 units on Stanwell site and 5 units on Tarong site:
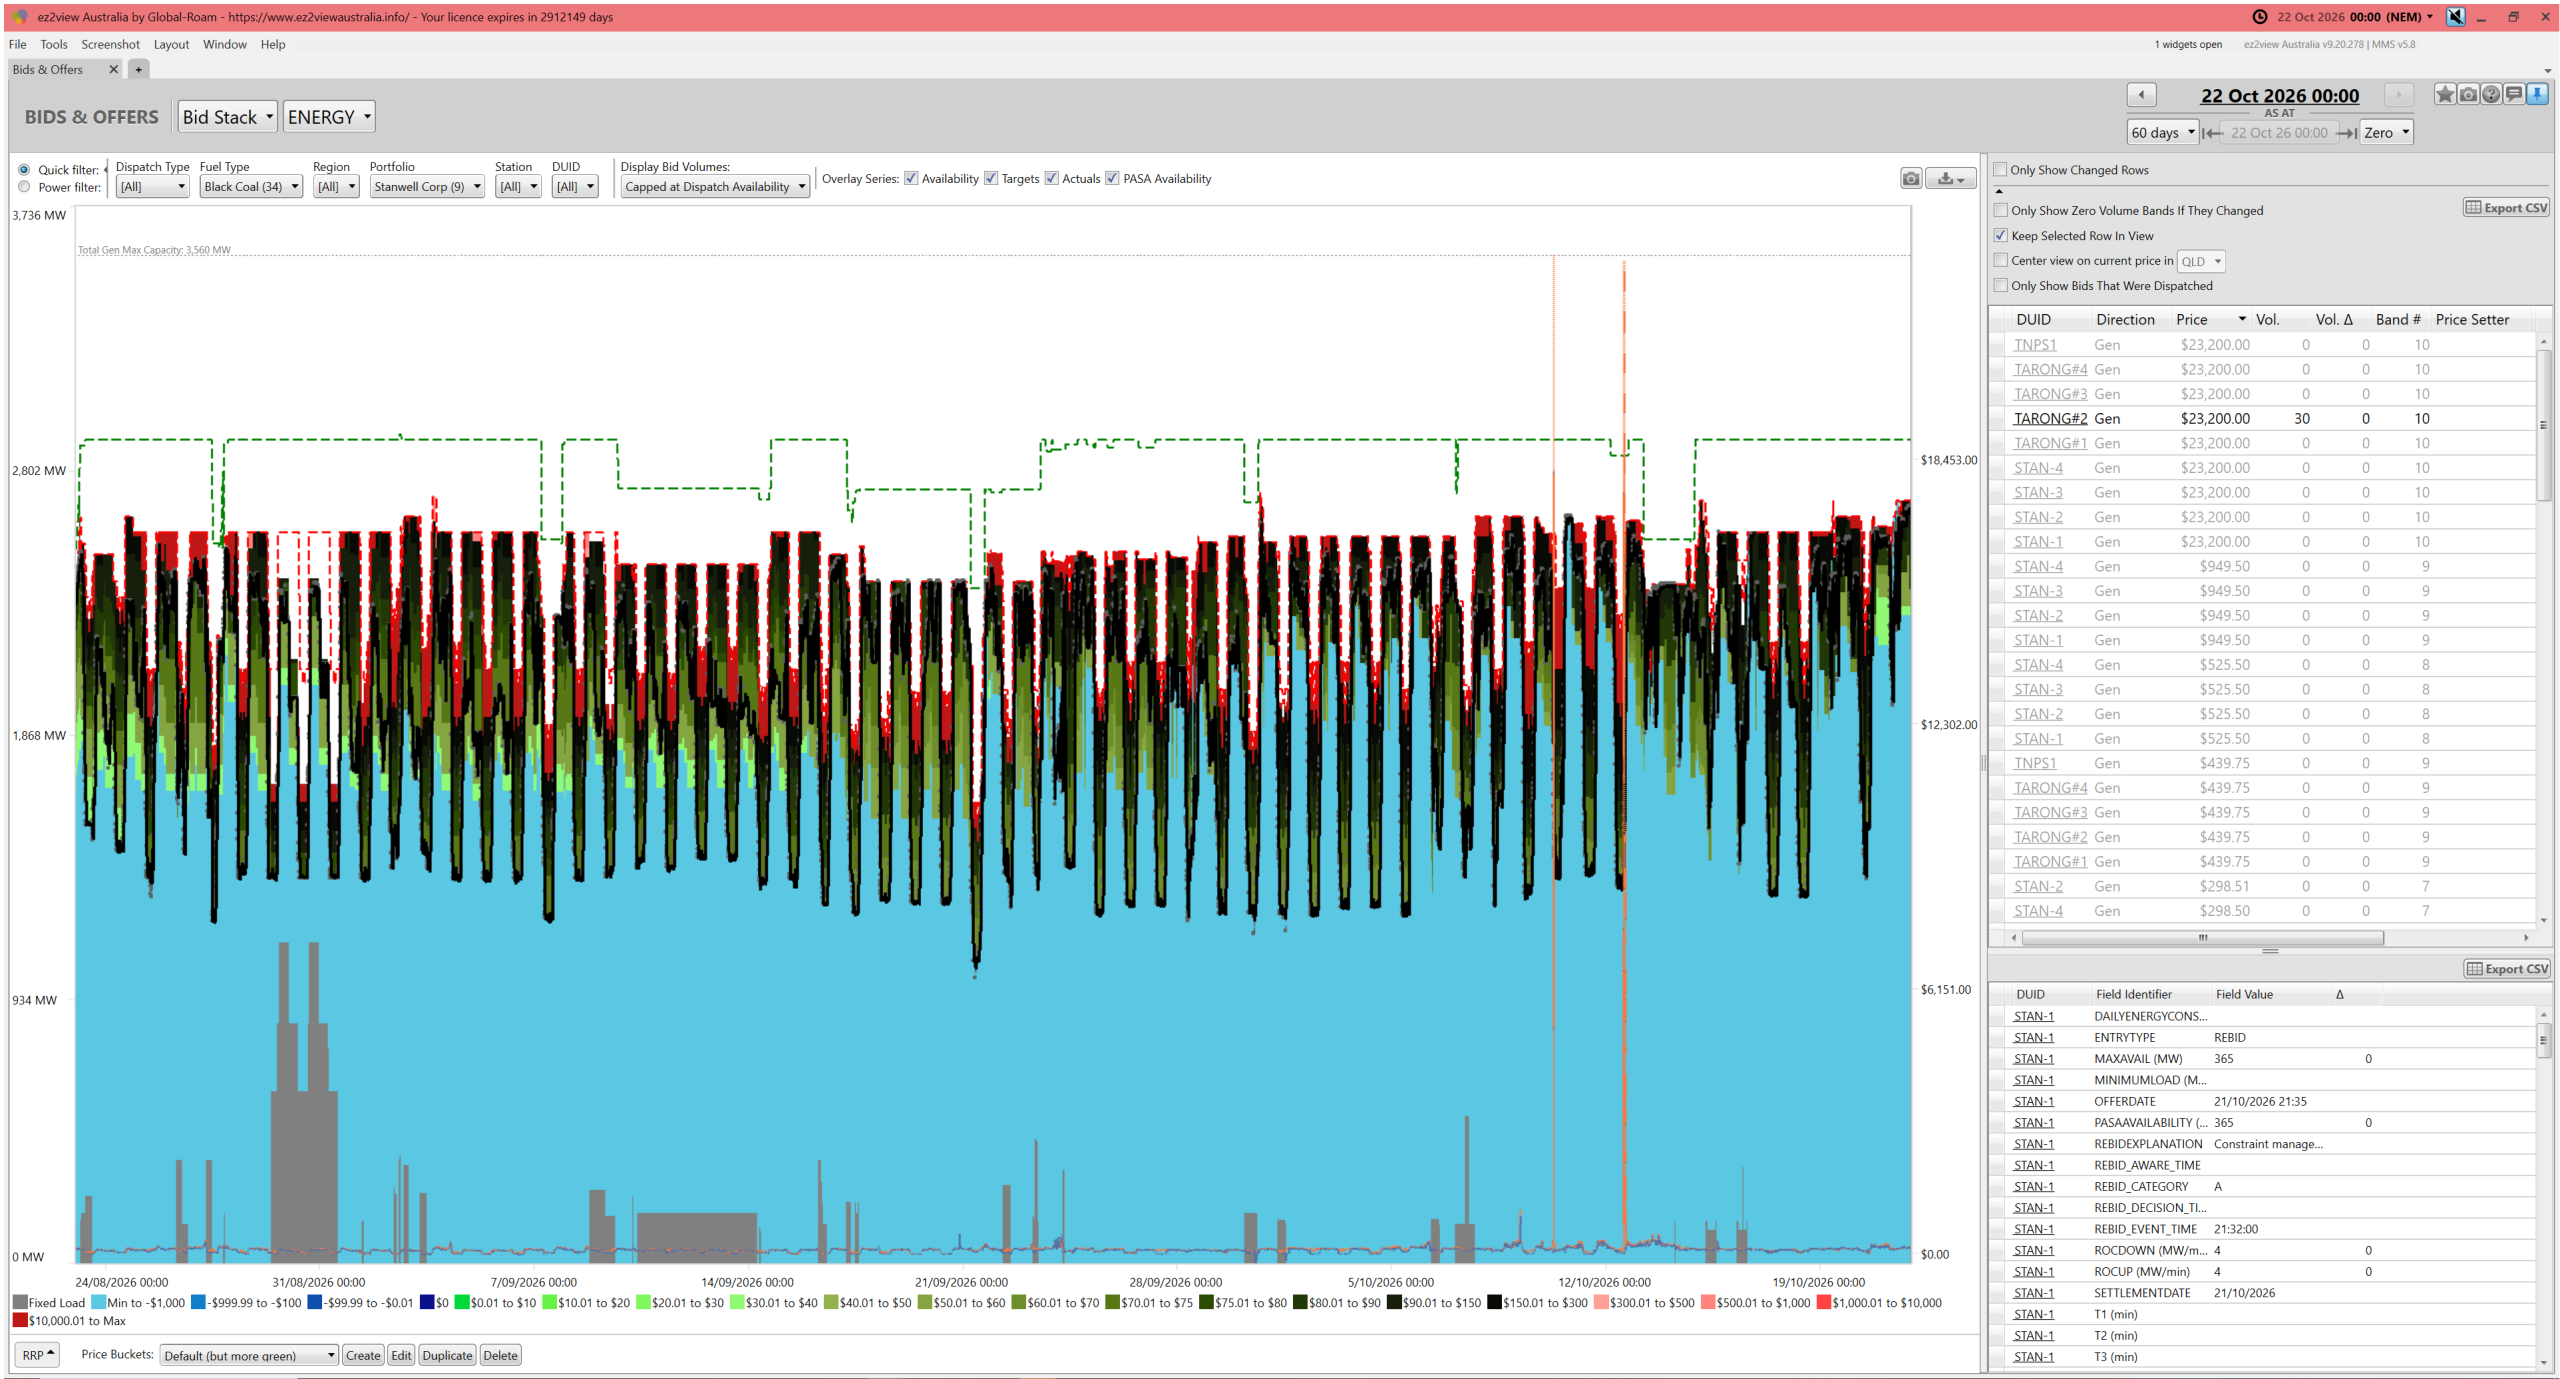
Similar to the case for CS Energy:
1) this is a very busy bid price range (because of 90 bid prices – albeit only really 20 variations with the 5 on the Tarong site identical in my spot check).
2) there were some variations … but perhaps the biggest was increased volume down at the Market Price Floor later in the period.
Remember the non-coal units!
A warning to readers who might latch onto this and think ‘it’s all coal!’ … other fuel type portfolio combinations might also shifted bid prices (we’ve just not explored that here)!

Every generator coal/gas/hydro/wind/solar wants to get the best price possible (with the caveat that whatever ASX/etc contracts they have can penalise pushing the price up too much). There’s no conspiracy, that’s just how it works.
For Origin/Eraring especially, their FY26 report listed Eraring as having a spot price capture of $91/MWh, which is either very marginal or loss making. Given the choice of maintaining high output and losing money, or withholding output to force the price above their operating costs, of course they will choose to push the price up (if they have the market power to do so). That’s not nefarious, that’s just what you have to do. Origin is a gentailer, so running Eraring at a loss can work, as long as they can keep their customers. Driving wholesale prices below their marginal cost would essentially be gifting more margin to their competitors, which could see them undercut at the retail level.
Bayswater is interesting. There’s conflicting info on when their long-term Peabody/Wilpinjong contract expires. That contract was in place when AGL bought Macquarie Generation from the government, and was apparently around $33/t. “Coal Cost Projections”, May 2021, from AEMO/Wood Mackenzie shows their fuel prices doubling after 2027. “NSW domestic coal pricing study”, March 2023, lists the Wilpinjong contract as ending in 2026. I would have thought that the contract expiring would need to be announced to the market given how much of an impact it will have. Their FY26 report just says Bayswater coal supply increased $4/MWh, but that’s well short of the $22/MWh you’re showing. It could be that they’re shadowing Eraring, but they could have shadowed Eraring at any time. I’m leaning towards their coal contract expiring.
Also, every coalie is going to see its input costs go up due to increasing diesel prices.