

We’ve already posted and collated 7 articles here about yesterday’s Market Suspension in the NSW region.
Here’s one more … and apologise quite cryptic. This:
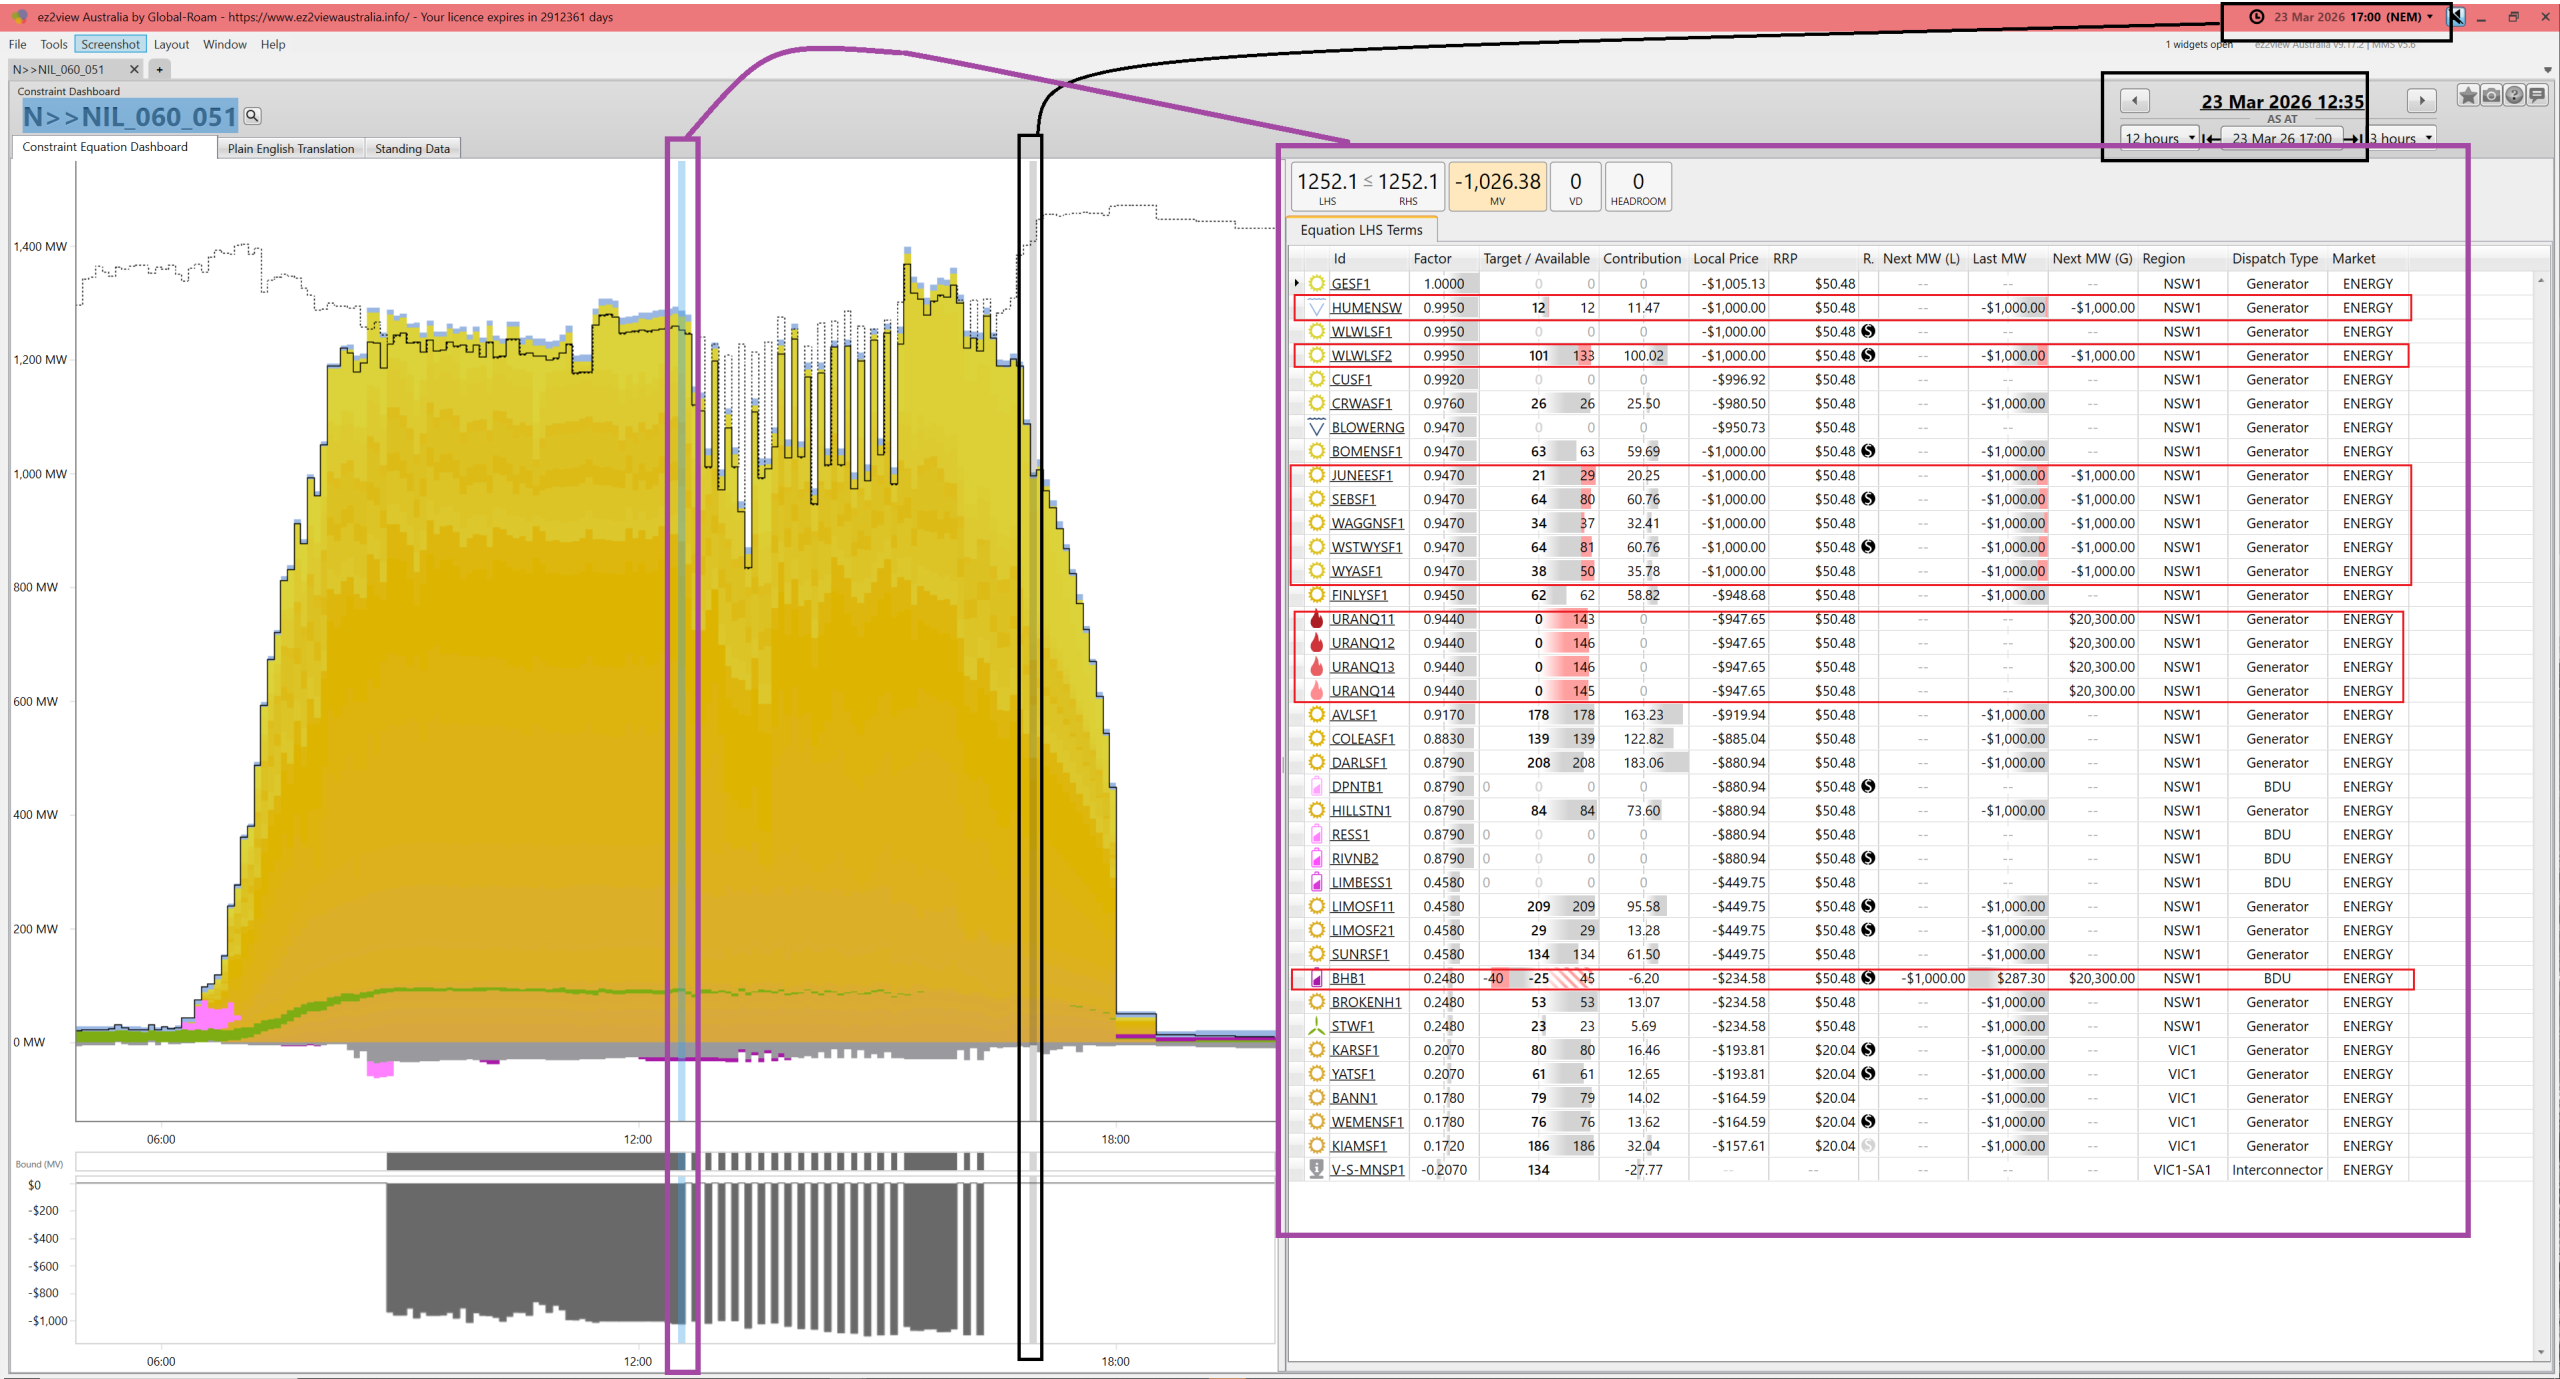
- shows a snapshot of the ‘Constraint Dashboard’ widget in ez2view;
- focused on the ‘N>>NIL_060_051’ constraint equation,
- that’s been:
- time-travelled to 17:00 (NEM time) on Monday 23rd March 2026; and
- set to look back 12 hours (so spanning more than just the period of the suspension)
- with the table focused on the 12:35 dispatch interval:
- … so after the suspension had commenced.
- with the constraint bound with a Marginal Value of -$1,026.38/MWh
- with 7 units ‘constrained down’
- and and 5 units ‘out of the money’.
There’s a bit of chicken-and-egg going on here, with the RHS of the constraint jumping around … and also the LHS as well:
- As a result
- But also feeding into the RHS, via ‘feedback terms’.
Keeping that in mind, note that:
- The gyrations start at 12:45:
- What happens first is a drop in the RHS (from 1,246.04MW to 1,119.59MW … so a drop of 126.45MW)
- Which pulls down the LHS
- Which then flows into 12:50:
- With a bounce on the RHS in the next dispatch interval.
- Which unloads the constraint on units on the LHS
- and (with some other nuances) there’s a semi-regular cycle established.
We’ll come back to this, later:

Be the first to comment on "A quick introduction to the gyrations on the ‘N>>NIL_060_051’ Constraint Equation during NSW Market Suspension"