
This is a brief post observing the NSW energy price today, where it has reached and landed near the Market Price Cap (MPC) of $20,300/MWh for 4 successive intervals (11:00 to 11:15). Our NEM Map widget, screenshot below, captures prices at the time of the initial spike at 11:00.
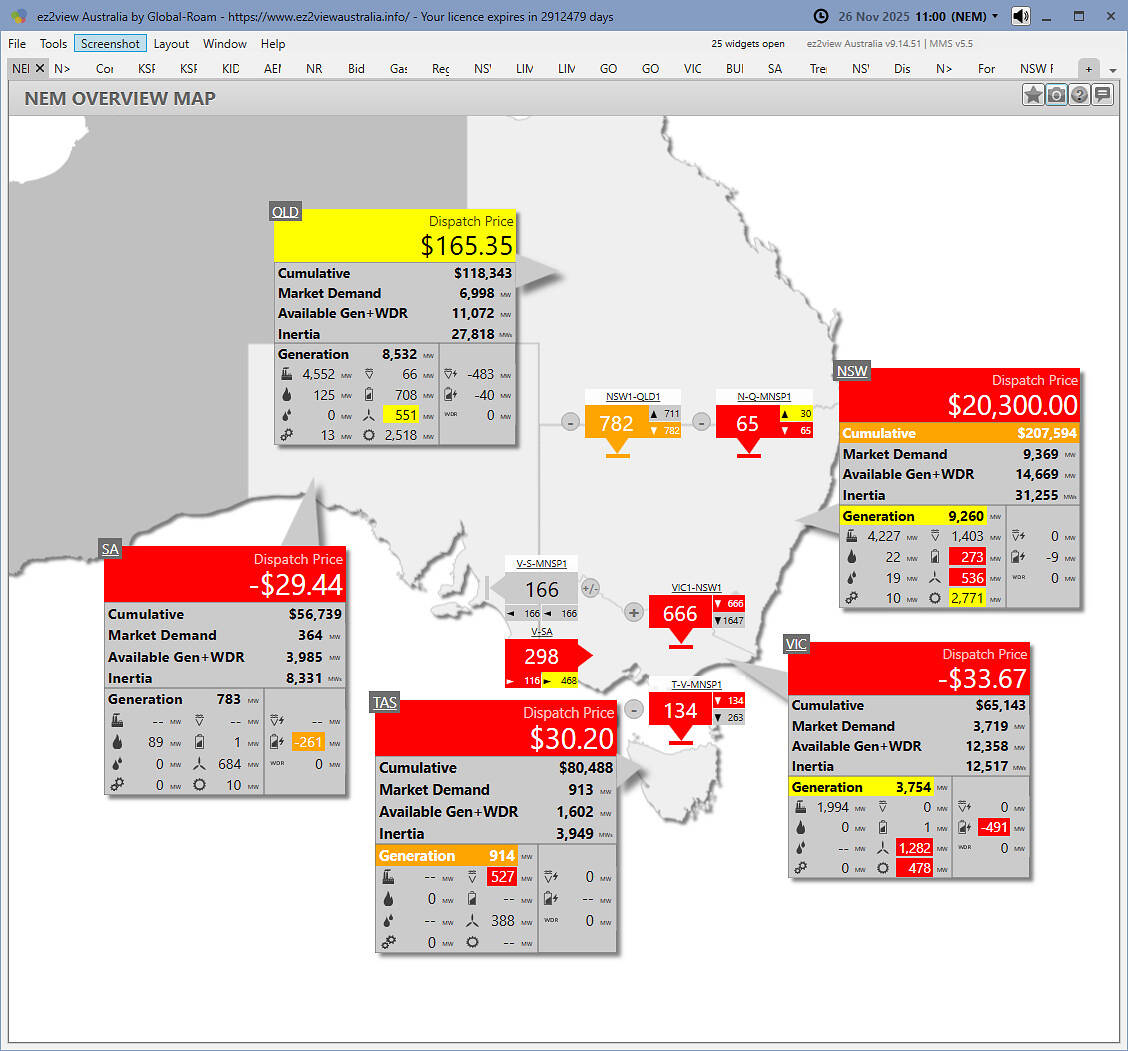
Source: ez2view’s NEM Map Widget. Screenshot taken at 11:00am NEM time.
In the screenshot we can also see some other aspects that, time permitting, we might delve further into:
- Counter price flows from NSW into VIC.
- Flows from Queensland into NSW were at the interconnector limits for that interval.
- Generation changes in NSW appears for Battery output (up) as well as wind (down) and solar (up).
Leave a comment