
AEMO declared Aldoga Solar Farm as non-conforming, over two bouts, on Sunday 12th October 2025. By as much as 337 MW.
Read about this in Two bouts of >2 hours of Non-Conformance at Aldoga Solar Farm on Sunday 12th October 2025.
In the first bout the unit was economically curtailed (the energy bid was priced out) yet the unit continued to generate. A semi-dispatch cap was in place therefore the oversupply from the semi-scheduled unit (relative to the target of zero) led to the non-conformance.
An initial peek at impacts on system frequency were also touched on in Four hours of Mainland Grid Frequency, on Sunday 12th October 2025. There was a spike but levels remained within the NOFB.
The rise in frequency was associated with the oversupply of energy from Aldoga, but the extent of the excursion appeared to be reigned back, we presume through PFR and also via Regulation FCAS.
In this article we inspect power deviations from dispatched units that would have contributed to the frequency rise, and the deviations that would have contributed to the correction.
Deviations from target pushed frequency high
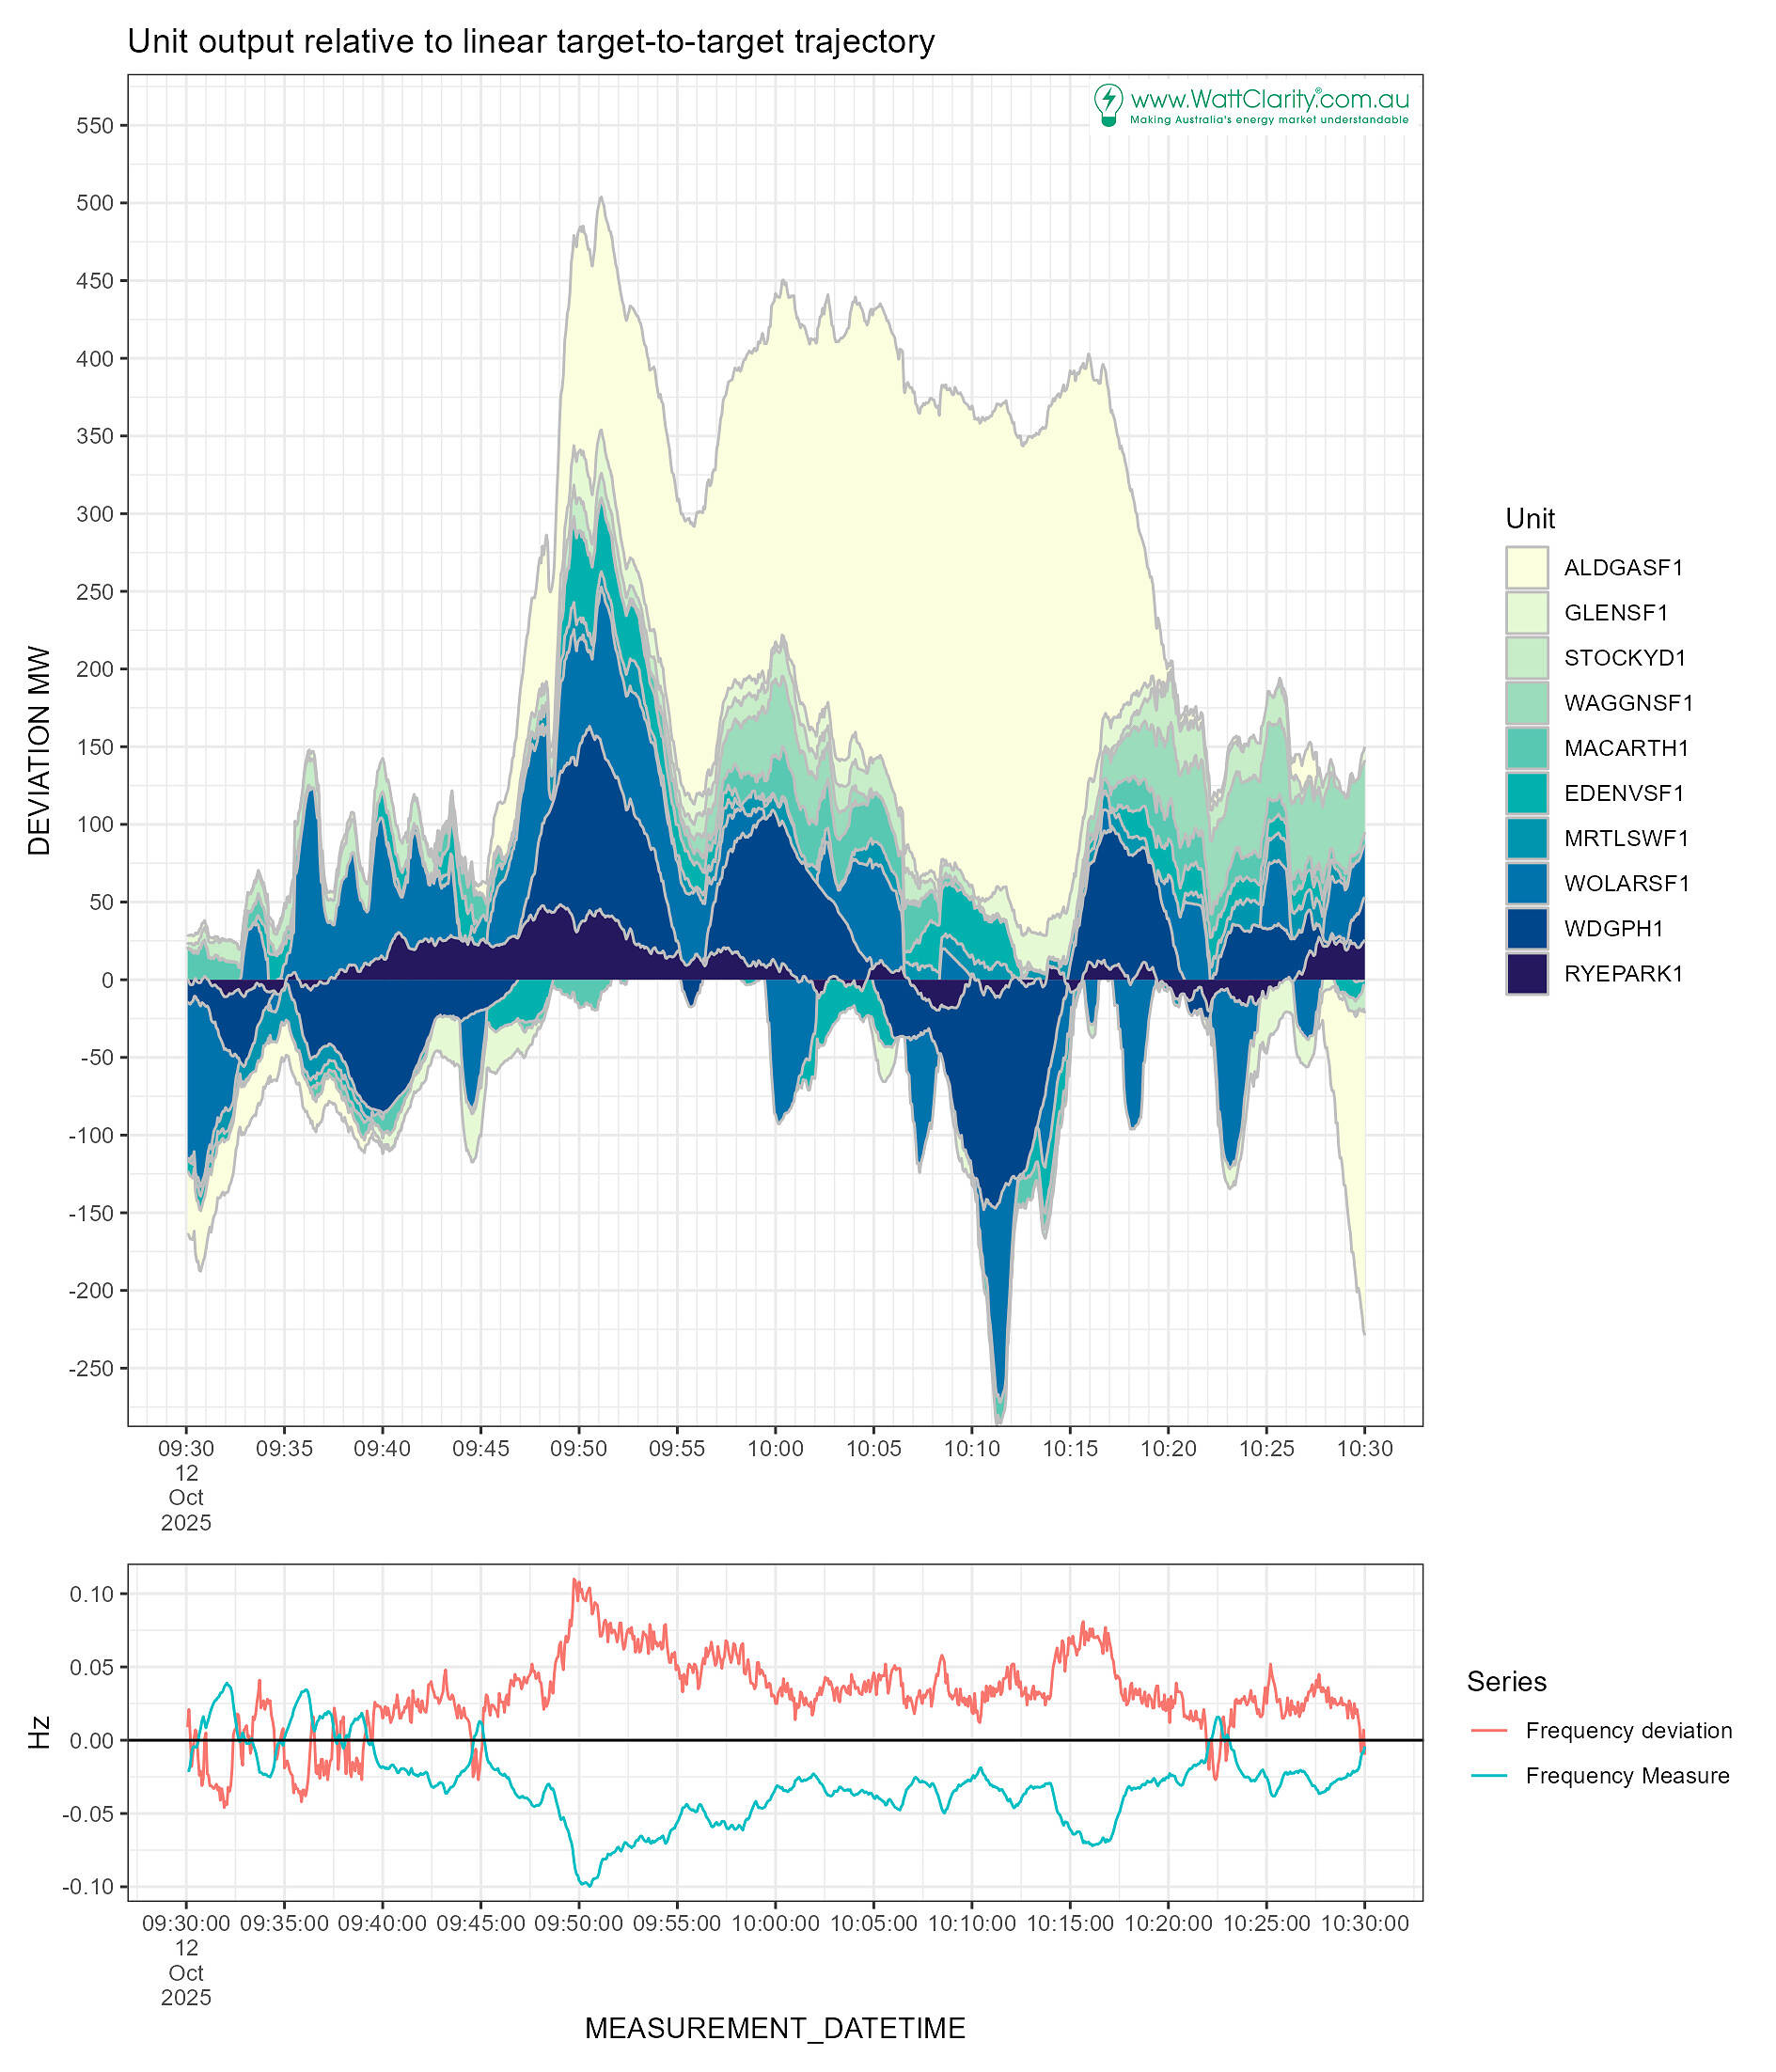
We ranked the units with the greatest overall positive deviations (output high relative to the linear trajectory between targets, referred to as DEVIATION MW) in the period between 09:50 and 10:15. This was done to inspect the period when Aldoga (ALDGASF1) was off-target, leading up to the first non-conformance period.
Once the non-conformance constraint came on the unit was given a persistence target and was able to be closer to the resultant targets (by end-of interval), hence the smaller deviations after 10:15.
In the chart we see Aldoga with the greatest positive deviations. The other 9 units, making up the top 10 for the period, contributed up to 350 MW just after 09:50 but it was Aldoga that had the largest magnitudes after 09:50. The remaining 9 units sometimes had negative deviations.
Corrective power deviations
In the above chart the second panel showed system frequency deviations (from 50 Hz) were positive. The frequency measure, which expresses the need for corrective responses, was negative indicating negative unit MW deviations would be judged to help correct frequency.
The top 10 units that contributed a generally corrective response overall are charted below. The top 5 were all batteries.
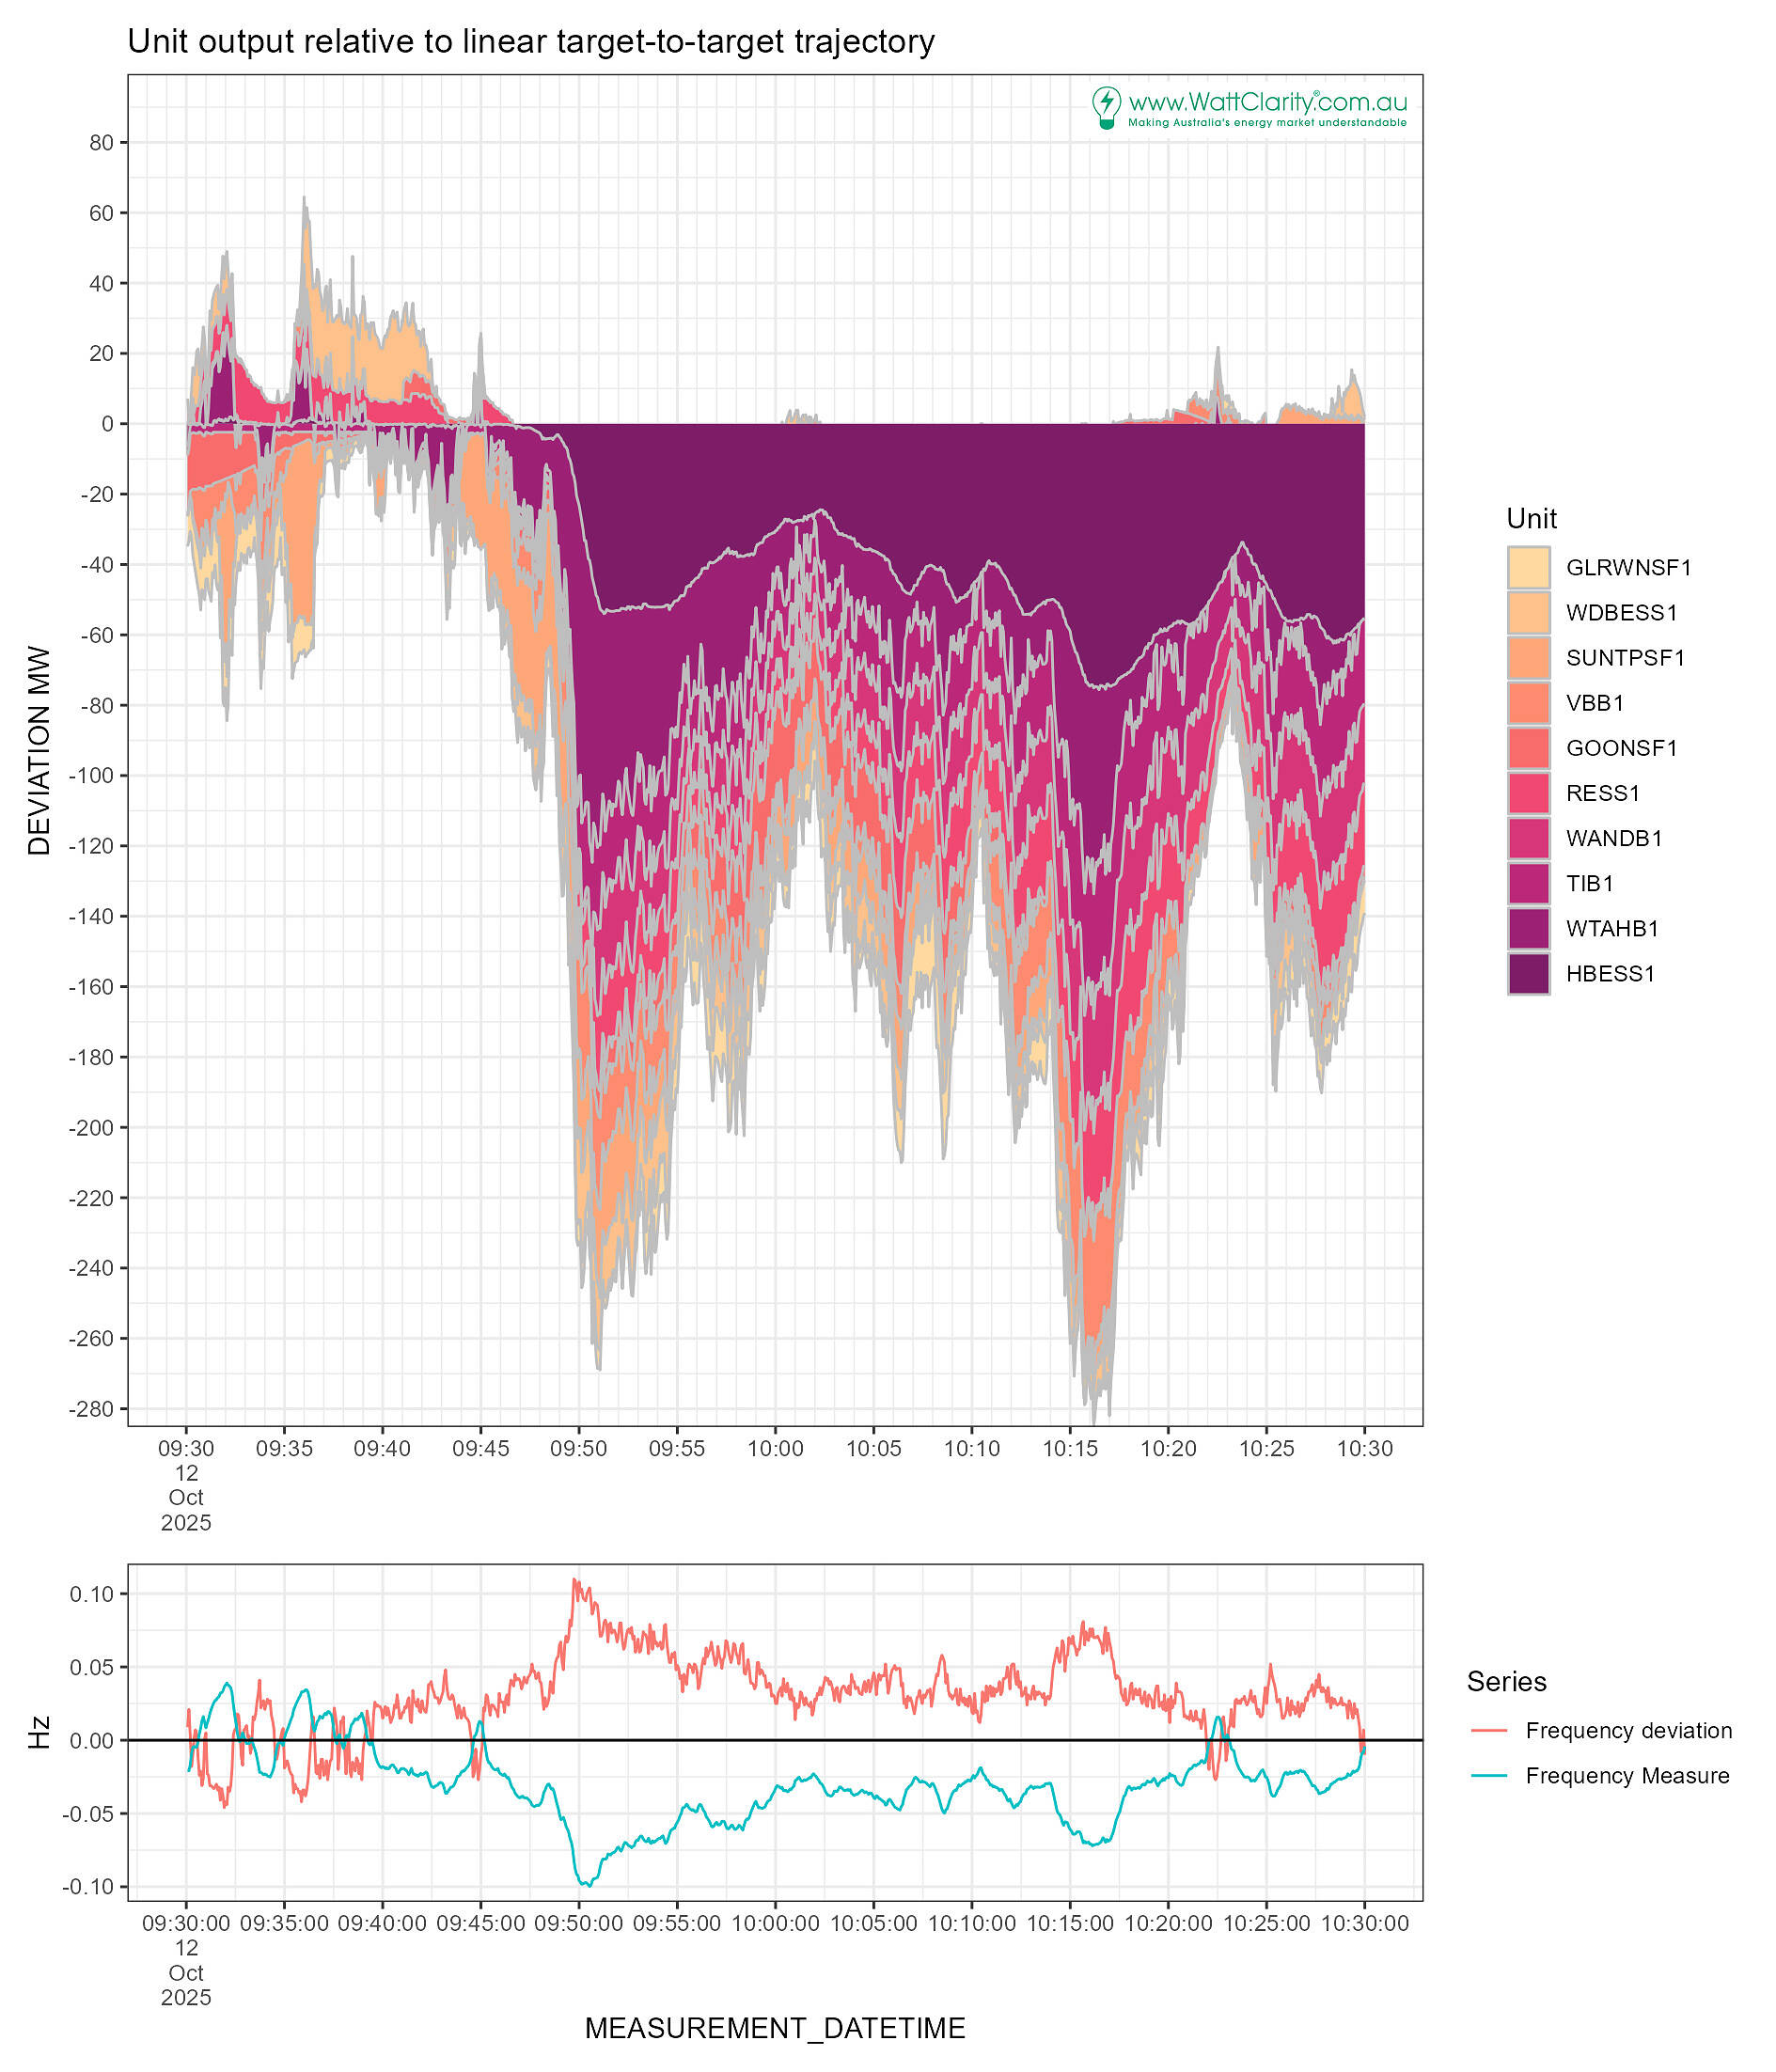
The pattern of the Hazelwood BESS (HBESS) deviation appears smooth and provided the greatest response. The Waratah BESS’s response seemed to introduce some small variability to the stacked chart.
Some solar farms make up this top 10 but we haven’t determined in this article whether that was by chance, through the availability forecast being on the high side, leading to a high dispatch target that was not met.
Although we have only looked at the top 10 corrective responses, the remaining units in the NEM also played a role. For the Mainland frequency control requirement the peak corrective response (which produces the requirement for corrective response, RCR, each dispatch interval) averaged around 804 MW across the 9:50 – 10:20 period, meaning other units were contributing also through PFR and regulation responses.
Cost impacts
At a glance it seems that Aldoga’s deviations incurred a $1,095 cost overall (FPPs + Regulation FCAS costs) over the intervals between 09:50 to 10:20. This 35 minute period accounted for roughly half the unit’s total cost for the day.
Lower Regulation costs for the mainland service appear to have been below $10 each interval, supporting limited costs. Yet this also highlights the potential for high costs in proportion to the regulation price which could coincidentally spike to its current cap of $20,300 .
We observed that generally (in accordance with the frequency measure being negative) no raise regulation usage was determined in this 35 minute period. The lower regulation usage was on average 72%.
Leave a comment