On Tuesday this week 19th August 2025 there was a significant frequency spike that has caused some consternation across various pockets of the National Electricity Market
Prior analysis
Already here on WattClarity, we’ve posted three sequential pieces of analysis (with more to come, collated here), as follows:
1) Soon after it happened, Linton noted the ‘Mainland Frequency Spikes to 50.2 on Tue 19th August 2025’.
2) Before wrapping for the day, and without the benefit of ‘next day public’ data sets, Linton also explored this ‘High level view of some contributing factors to 19 August frequency spike’;
3) The following day (Wed 20th Aug) Linton was above to follow with the 3rd article:
(a) about ‘Unit deviations from target on Tuesday 19th August 2025’.
(b) utilising the ‘next day public’ dispatch interval level data.
… we followed this post with some discussion starters on social media in various places, including:
i. Here on LinkedIn (noting that – at the time of posting this – some discussion has already followed there, independent from us), and
ii. Here on Twitter, and
iii. Here on BlueSky.
… and there will be more to come (to the extent that time permits).
Proximate questions … not explored/answered here
As seen in the social media references above, and in many one-on-one conversations we’ve been involved in, there have been many questions raised about events of Tuesday 19th August – many quite understandable, including:
Q1) On the causal side …
there are questions such as …
A) What caused the frequency spike?
… then, when hearing that the issue was a mis-match between Availability (in the form of UIGF) at Semi-Scheduled assets…
B) … as a result of which, they ask was this related to AEMO, or to Self-Forecasts?
… then, when hearing the issue was related to Self-Forecasts …
C) Was it just one self-forecaster that experienced a fault, or were there several?
… then, when hearing the issue seemed to related to one significant vendor …
D) Which vendor?
… we believe we know (but are not going to answer that) …
E) How many units were seen to experience issues?
F) And, of course, the old chestnut … Who’s ‘to blame’?
… and so on…
Q2) Then, in relation to remediation …
… a similar sort of chain of questions
A) What was the role of Primary Frequency Response?
B) What was the role of Regulation FCAS?
C) Did Contingency Lower FCAS services trigger?
D) And, related to the above, ‘What saved the day?’
… and so on…
Some of these (more proximate/immediate) questions we’ll return to in subsequent articles, to the extent that time permits…
Three Broader questions
In this article, however, I would like to include 4 images, which each look at different data sets over a two-hour time range (from 11:00 to 13:00 on the day) – drawing from the AEMO’s 4-second data (that’s now published in the EMMS as part of a Schema Upgrade to support Frequency Performance Payments).
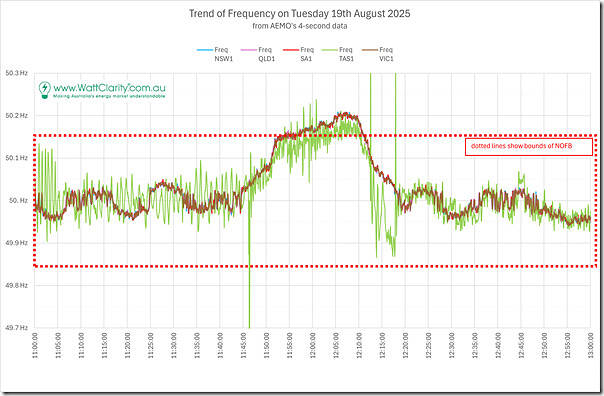
In the first image, we include the AEMO readings for frequency in each of the regions, with the main purposes of including this image
- to ensure that the Tasmanian readers understand that we’ve not forgotten them;
- but also to illustrate that frequency in Tasmania:
- whilst does broadly follow the mainland pattern (when Basslink is operational);
- it also operates ‘to the beat of it’s own drum’,
… so Tasmania has been excluded from the analysis below.
In this chart we’ve added in the range of the Normal Operating Frequency Band as an overlay, to help clarify how the mainland frequency excursion
- appeared in the 11:55 dispatch interval (NEM time)
- and persisted through 12:00 and 12:05,
- before peaking in 12:10
- then subsiding in 12:15
These 5 dispatch intervals will be the focus of other analysis that is more focused on the proximate questions above.
Q1) About the Semi-Scheduled category… is it sustainable and/or scalable?
As frequent readers know, we have been asking questions about the ongoing scalability and sustainability of the Semi-Scheduled category above.
1) There have been many articles written exploring different aspects of this – with a select few we’ve chosen to include in the focused category ‘Is the Semi-Scheduled Category Sustainable or Scalable?’.
2) Just to clarify (once again) these specific questions:
(a) Are not related to the variable nature of the underlying (i.e. VRE) energy resource;
(b) But moreso related to the manner in which they are enabled to operate under the current Rules.
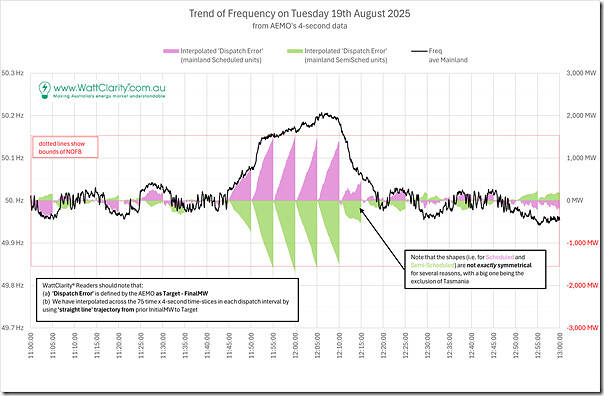
In this second chart, we’ve focused on the same 2-hour time range and utilised the 4-second SCADA data to derive an interpolated instantaneous ‘Dispatch Error’ :
1) using the way AEMO defines this:
(a) as ‘Target – FinalMW’ …
(b) … and clarifying that this is the opposite direction of what Linton did for ‘unit deviations’ in Part3
2) Noting that a linear trajectory of InitialMW to Target was used to apportion under and overs across all 75 x 4-second timesteps in the dispatch interval;
3) With individual 4-second derivations for each DUID aggregated to the relevant bucket:
(a) All Scheduled units on the mainland; or
(b) All Semi-Scheduled units on the mainland:
In this chart we can see that the two interpolated instantaneous ‘Dispatch Error’ shapes are almost the inverse of each other:
There’s a few different dimensions to remain cognisant of in interpreting the chart above – so (to make it easier) we’ve unbundled them into the two opposites:
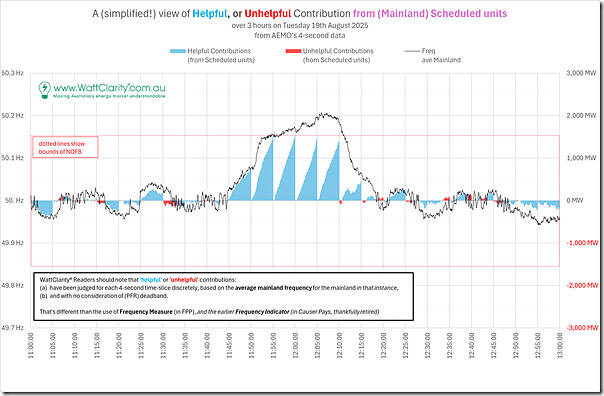
1) Helpful deviations (which would help to correct a frequency disturbance in either direction); and also
2) Unhelpful deviations (which would exacerbate the frequency disturbance).
Note that we’ve used ‘raw’ instantaneous frequency readings for each of these snapshots:
1) Which is different than the Frequency Measure (used in FPP) and the Frequency Indicator (used in the now retired Causer Pays method)
2) Remember these ‘Three headline observations, about the use of proxies for System Frequency in Frequency Control mechanisms’.
Were the Scheduled unit contributions (in aggregate) Helpful or Unhelpful?
We’ve done the above separately for both Participation Categories … starting with the Scheduled unit performance:
Remember this covers all (mainland) Scheduled units, across the mainland – including:
1) Older technology (like coal, gas, liquid and hydro); and
2) Newer technology (like BDU batteries, and negawatts).
As per the annotation on the image, readers should note that ‘helpful’ or ‘unhelpful’ contributions:
1) have been judged for each 4-second time-slice discretely, based on the average mainland frequency for the mainland in that instance,
2) and with no consideration of (PFR) deadband.
Were the Semi-Scheduled unit contributions (in aggregate) Helpful or Unhelpful?
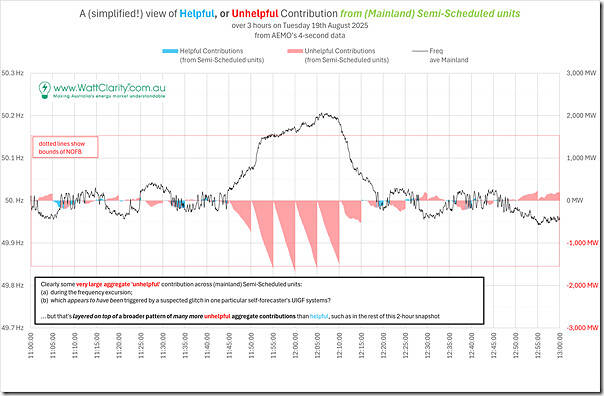
Let’s now contrast this with the Semi-Scheduled unit performance:
Remember that this covers almost all Solar and Wind units across the mainland … there are some small wind and solar units that are registered (and still operate*) as Non-Scheduled.
* as is the case in various ways in the NEM, there is some complexity – with AEMO requiring some Non-Scheduled Wind Farms in South Australia to operate as Semi-Scheduled. This was discussed in February 2022 in ‘How are South Australia’s non-scheduled wind farms participating in the market now?’.
As per the annotation on the image:
1) Clearly there were some very large aggregate unhelpful contributions:
(a) across 6 dispatch interval – with 4 in particular (collective Dispatch Error of approximately –1,500MW!),
(b) coinciding with, and driving, the frequency excursion.
2) We’d noted in Part 3 (and above) that this appears to have been triggered by a suspected glitch in one particular self-forecaster’s UIGF systems?
3) However, it’s also worth noting that this (apparent) proximate cause has been layered on top of a broader pattern of (many more) unhelpful aggregate contributions than helpful.
… which, based on our work in trending Aggregate Raw Off-Target across Semi-Scheduled units, is (unfortunately) not a surprise.
Q2) Implications of this incident in concerns and considerations about the ‘rise of the machines’
For a number of years we have also been completing analysis, and publishing articles about ‘the rise of the machines’:
1) Some have been added into the category ‘The Rise of the Machines’;
2) Whilst others have been tagged in various ways.
Notably, the draft report of Nelson Review, for instance, posed questions about (some aspects of) this phenomenon:
1) Specifically focused on auto-bidders;
2) But we wonder if sufficient focus was invested (by the Nelson Review Panel) on the self-forecasting space as well?
The incident on Tuesday 19th August 2025 just reminds us of these considerations, and poses more questions – that we’ll explore, as time permits…
Q3) About self-forecasting – tricks, traps and games.
No doubt there’s a very embarrassed Self-Forecast Vendor out there currently, who is grappling with several layers of questions about what went on, and the implications.
1) Others are doing their own assessments in parallel.
2) To us, this event also reminds us of some considerations and concerns we’ve previously raised with respect to the ‘Games that self-forecasters can play’.
… and we’ll look forward to finding some answers to questions we have raised internally with respect to the events of Tuesday 19th August 2025.
These questions have been posed now, in order to stimulate discussion – and cognisant of a few looming deadlines, including (but not limited to) the two deadlines noted earlier:
1) The Wednesday 17th September 2025 due date for submissions on the Nelson Review draft report; but also
2) My presentation to wrap up the up-coming ‘NEM dev 2025’ conference :
(a) a joint Academic + Industry conference in Brisbane on 7th and 8th October 2025
(b) that I have been invited to speak at.
So stay tuned for more…


Could this article be any worse written.
Bring back the last 2 weeks of authors, pls.
Would be very interesting to have a look at a longer period – before and after. There appears to be a frequency oscillation here with an approximate 15 minute return period prior to the one at 11.45am taking off. The exceedance occurred at 11:55 but it all started 10 minutes before that.