
Following our earlier article on wind units, we prepared the same investigation focusing on the solar fleet.
With the Frequency Performance Payments (FPP) reform to start financial operation on 8th June, and solar unit self-forecasting for dispatch availability being a critical ingredient into how costs and revenues might play out, we refresh our bearings as to the adoption and use of dispatch self-forecasting.
Dispatch self-forecasting is the forecasting of a unit’s unconstrained intermittent generator availability (UIGF), for the next dispatch interval. The forecast is a self-forecast when the forecast comes from the participant responsible for the unit.
This self-forecast may be the one used in dispatch to set the unit’s availability, trumping use of the forecast from AEMO. Further detail can be found at What inputs and processes determine a semi-scheduled unit’s availability.
We’ve followed the uptake in self-forecasting since its start in 2019. We’ve monitored changes in adoption and patterns in use in our Generator Statistical Digests and prior releases of Quarterly Insights. Although we aren’t currently releasing a quarterly updates in 2025, we are curious to see what the data says, to the end of Q1 2025 (and beyond).
47% of dispatch intervals for semi-scheduled solar units are seeing a self-forecast used
That 47% is the green bar in the chart below at March 2025. It is lower than all months since December 2023.
The percentage represents forecasts from 67 large solar units actively (now or in the past) self-forecasting. That is 67 out of 120 units (56% of units as at Q1 2025 ending).
An additional three units were forecasting by the end of Q1 2025 but appeared to be in a ‘commissioning’ phase, not yet accredited for use in dispatch (Walla Walla 1 & 2 and Kingaroy). This is likely associated with the mandatory initial assessment process which is part of the AEMO self-forecasting procedures.
The chart below, running from 2019 to the end of Q1 2025, shows the percentage of intervals where self-forecasts were used. After some strong adoption between 2020 and 2022 a decline in usage is observed in 2022, leading into 2023. The percentage grew from mid 2023, once again, but has not yet eclipsed the peak month – August 2022.
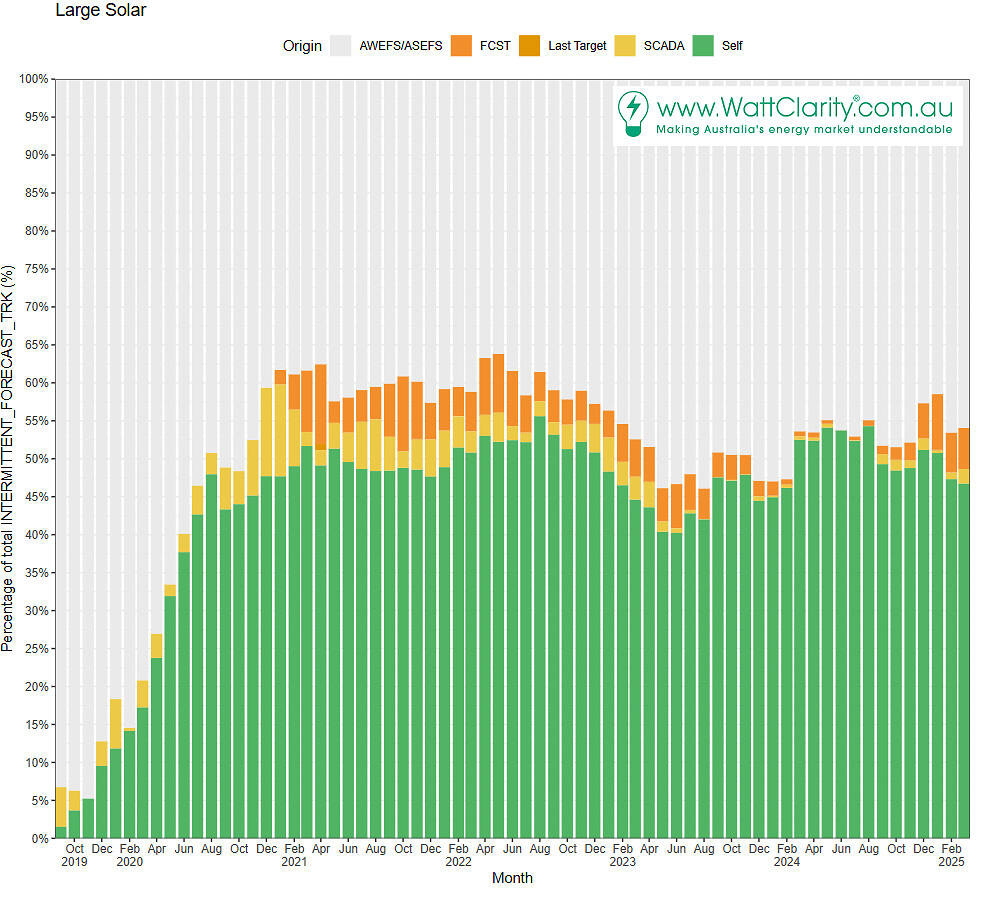
A history of self-forecasts used in dispatch
When we take a glance at the occurrence of forecasts used in dispatch, we observe some gaps of different lengths and at different times.
Green bars indicate an interval when the self-forecast was used, grey otherwise.
Grey periods from 2019 up to the first green bar represent the period before the self-forecast was actively being used in dispatch.
Most recently Girgarre Solar Farm started. The first unit (solar) was Tailem Bend 1, back in 2019.
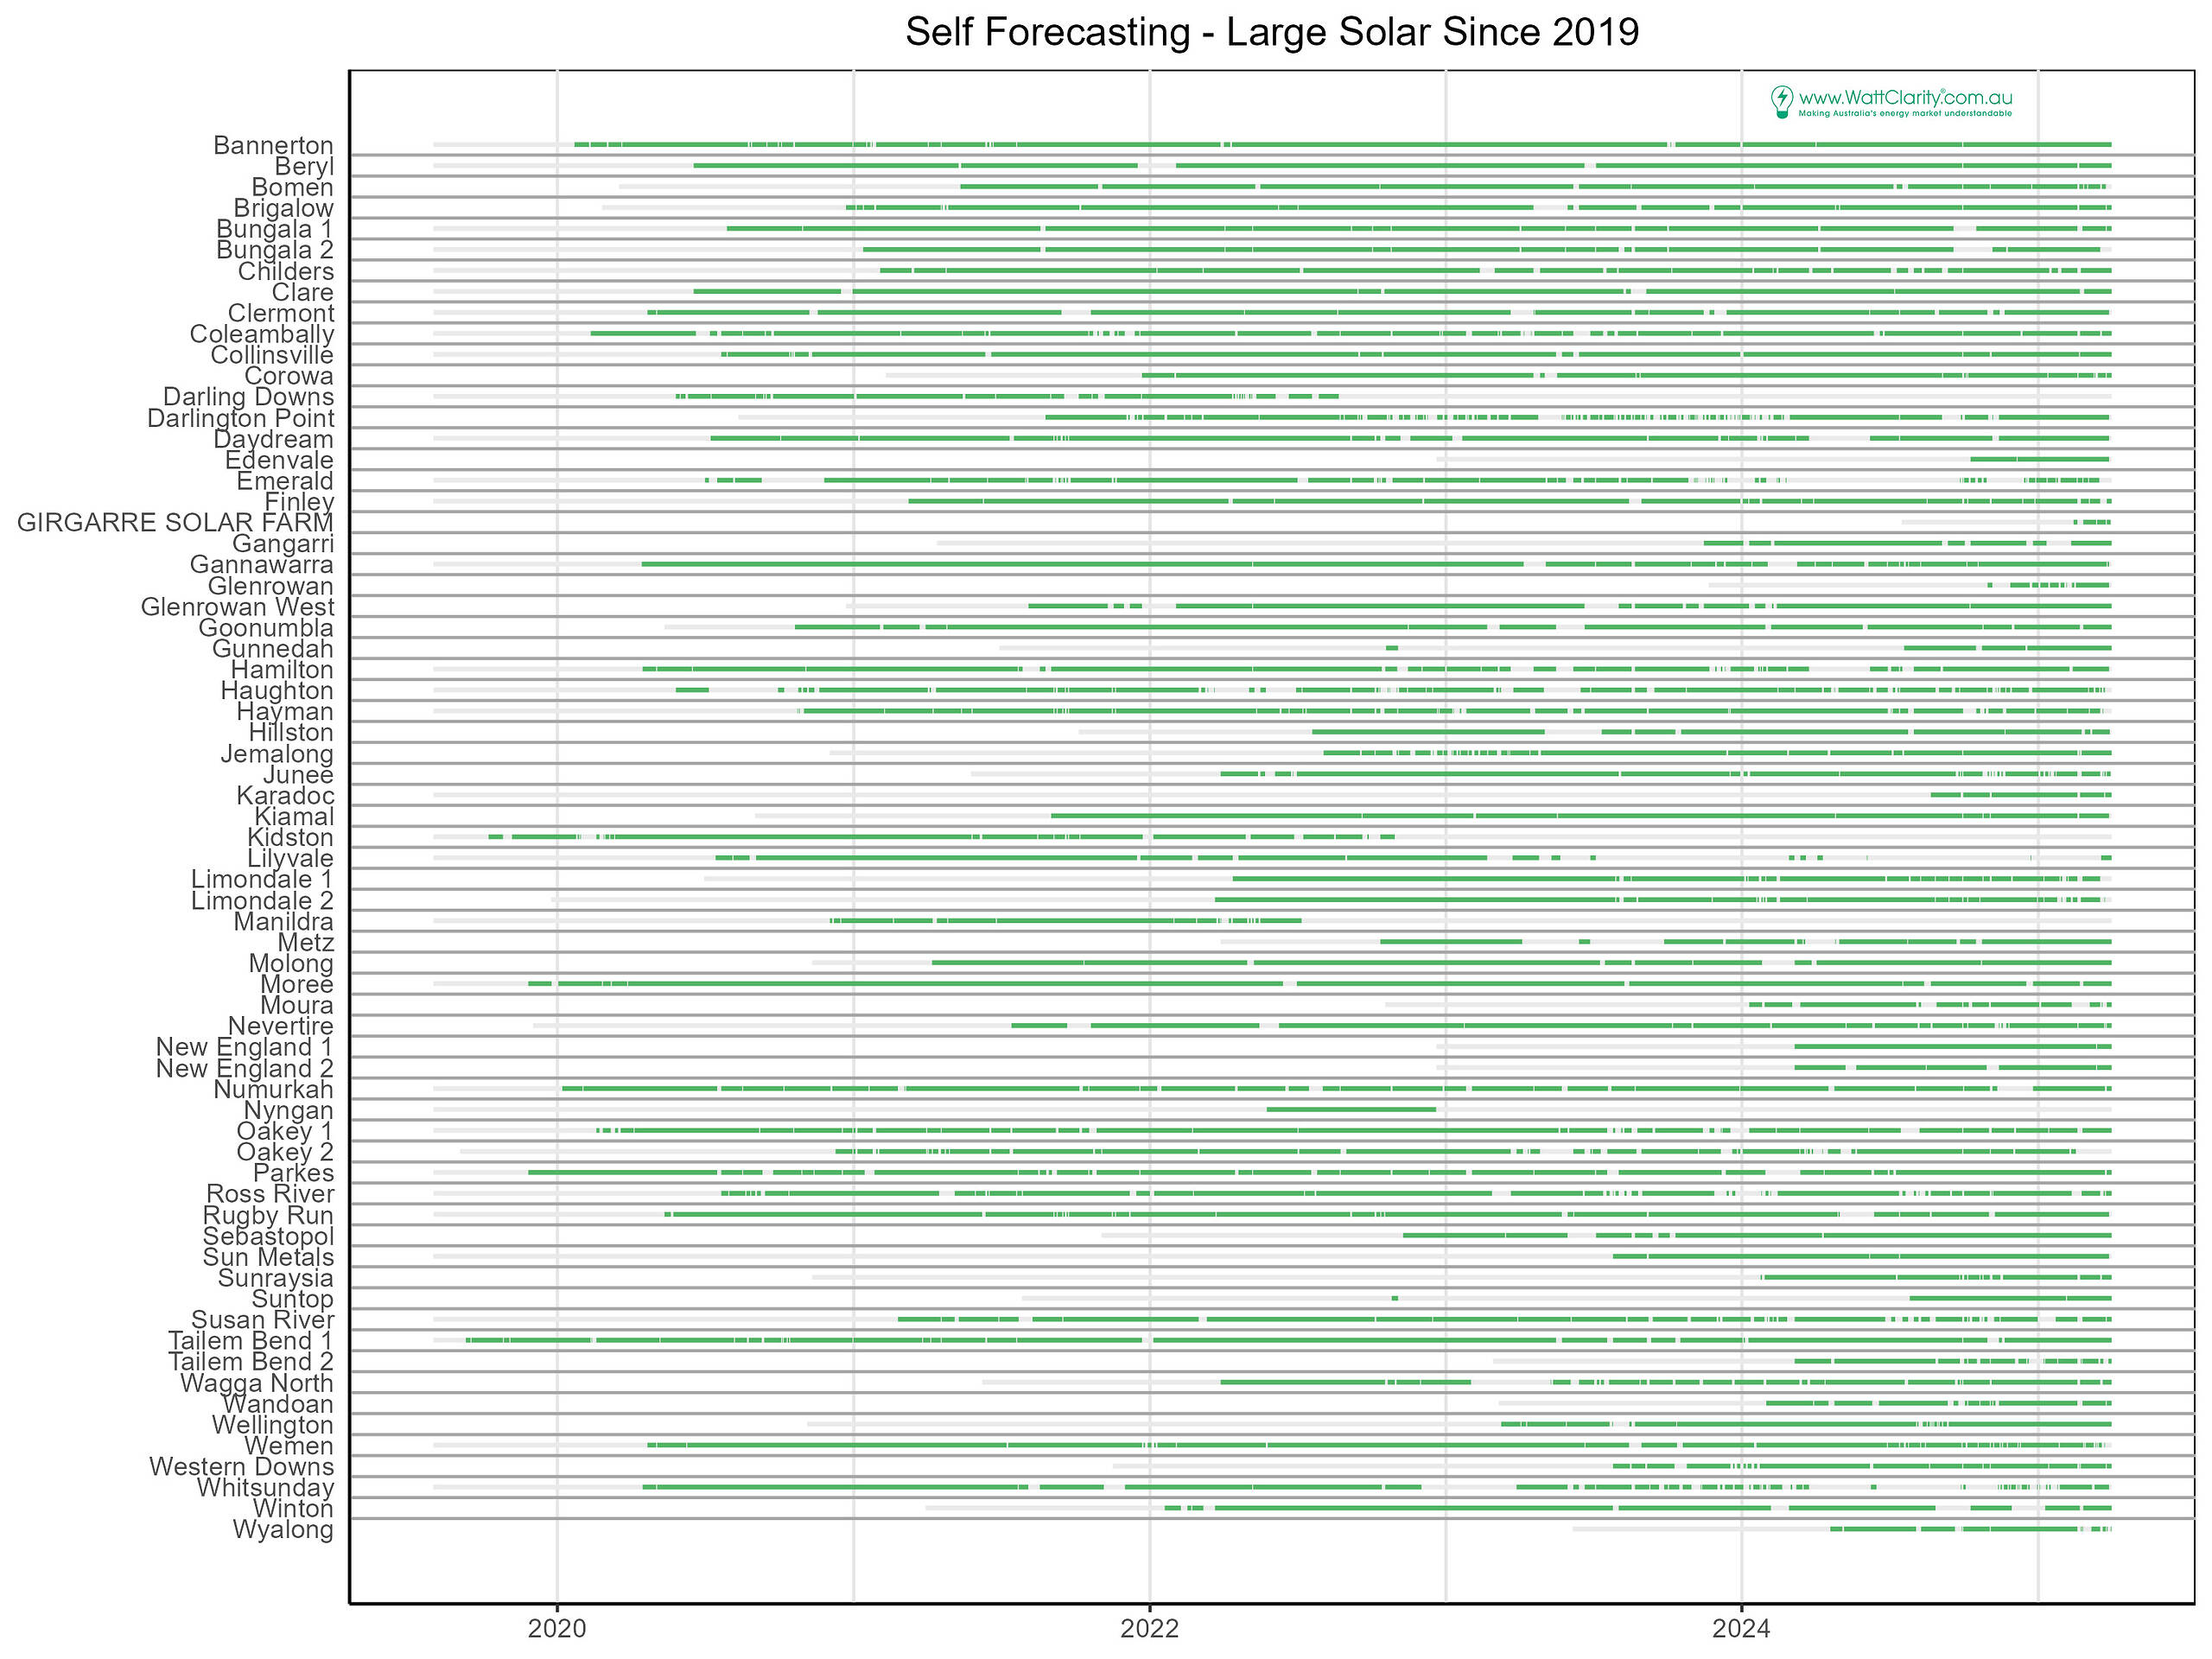
Wide gaps (grey bars) of a week or more are observed and attributed to periods when the self-forecasting system was suppressed or off. Various reasons could restrict self-forecast from being used in dispatch including maintenance (on-site or in forecast systems) and forecast performance.
Yet previous studies for WattClarity have also correlated periods with no forecast to times when the semi-dispatch cap is on, and in the intervals following the semi-dispatch cap releasing. In semi-dispatch cap periods unit output is typically (but not always*) capped below full availability, separating any link between unit output and the renewable resource.
* A unit’s target is not necessarily capped below its availability when the semi-dispatch cap is on. It is possible, and for some units common, to be dispatched at full availability in the presence of a semi-dispatch cap. In these situations, a more accurate self-forecast than AEMO’s can be of benefit for:
-
- maximizing generation – a more accurate availability forecast can afford the closest match between resource potential and dispatch target, and
- minimizing exposure to FPP and regulation FCAS costs which can be higher under SDC periods – improved accuracy means dispatch levels can be met.
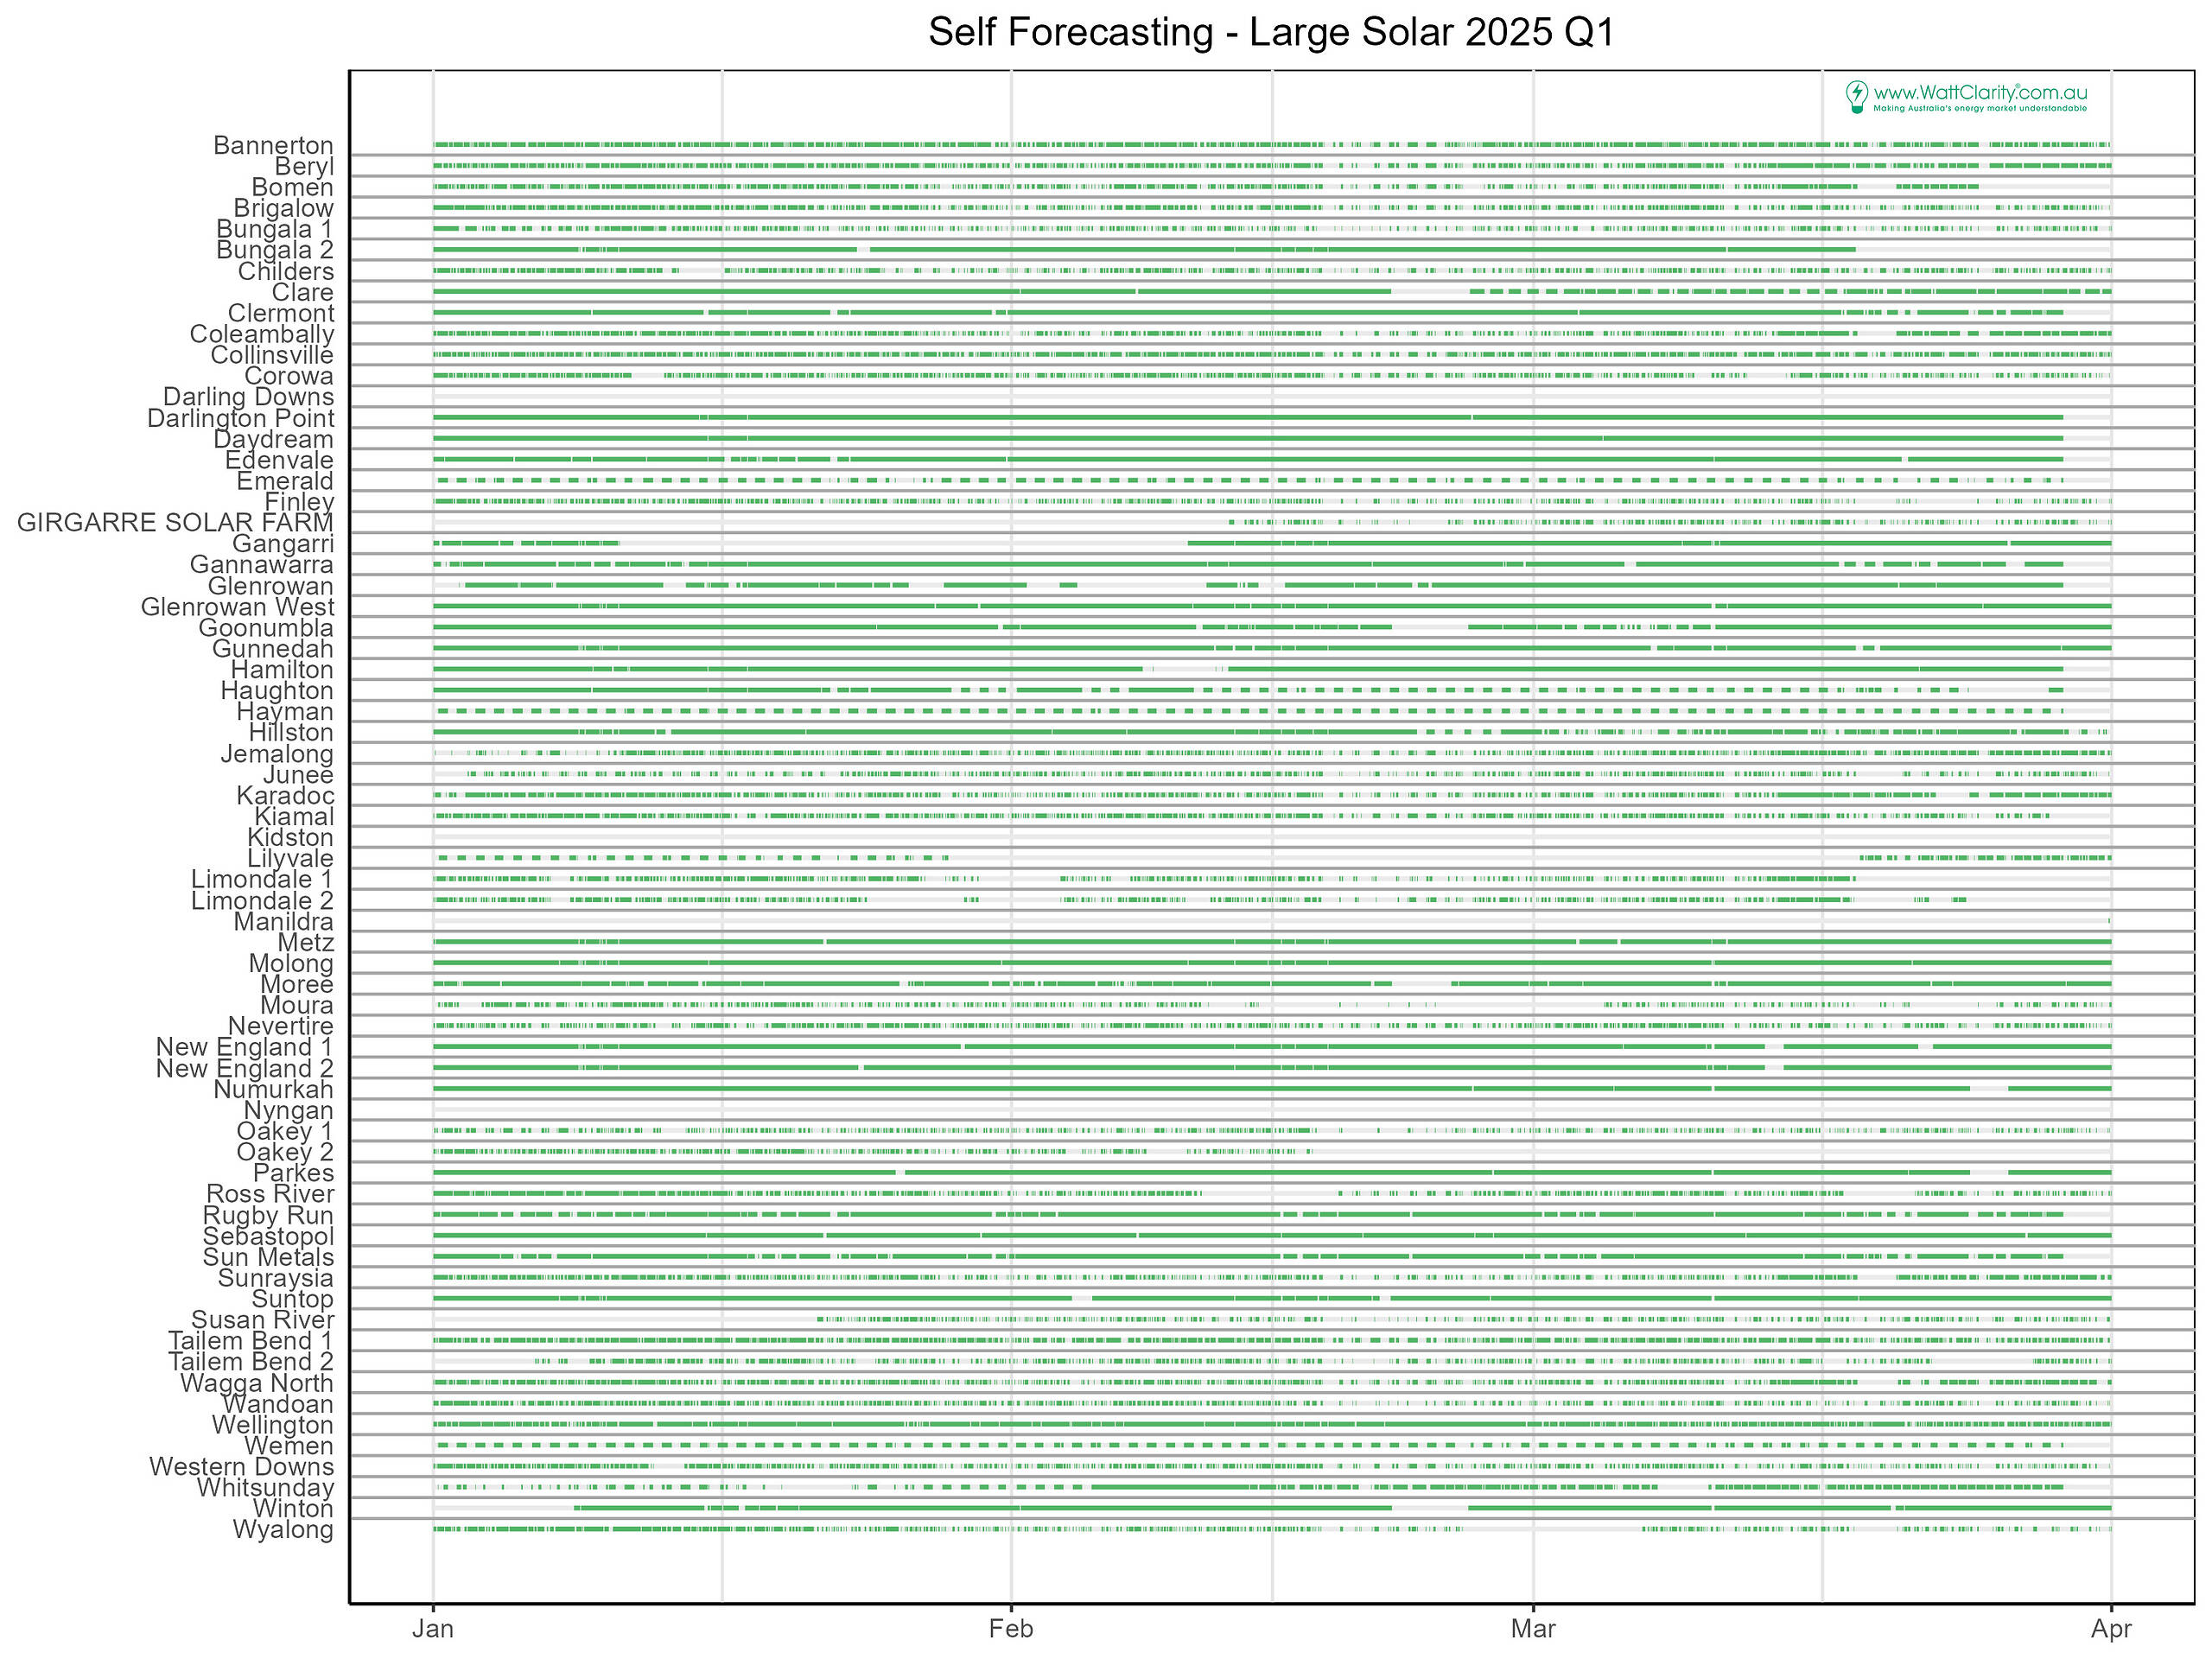
The recent Quarter, Q1 2025
In Q1 2025, chart below, we saw most units experiencing regularity with forecasts used in dispatch. This is indicated in the high number of green bars.
An interesting period happened at the end of March – when 14 units stopped seeing forecasts used in dispatch. The timing was unusual and unexpected to impact so many units at roughly the same time. The timing did not align with a performance assessment window.
When there are gaps, was the unit suppressed?
Delving one layer deeper, we categorise the self-forecasts by suppression ‘state’. We also extend the chart to 15th May. A unit’s self-forecast may be suppressed by AEMO if it fails the weekly performance assessment, or by the participant if and when they elect to do so.
In the next chart we can see the gaps on 30 and 31 March. Recalling the white cells we observed in the section above indicate no self-forecasts were made, this applies to the chart belo0w too.
The gaps on 30 and 31 March suggest a possible glitch that spans March the 29th until the 1st, for those units with white cells leaving two full days in between without any self-forecasts. However, we observe that self-forecasting for those units returns to normal on the 1st April. We noted this feature in the wind unit analysis: Adoption and use of dispatch self-forecasting for wind units, Q1 2025.
Other features are uncovered include:
- Units new to forecasting appear with long light purple periods that follow white. No green or gray (AEMO suppression). This is likely due to initial stages in commissioning the self-forecasting system (mentioned above, the initial assessment process).
- The new entrant Cohuna, accompanies Walla Walla 1 & 2 and Kingaroy.
- White gaps (no self-forecast issued in the day): rare, outside of March 30 and 31.
- Some units experience good use of their self-forecasting system indicated by dark green cells (full day forecasting).
- Some units appear to rely on participant suppression, indicated by grey ‘mixed’ states observed in the day. This represents self-forecasting with one or more intervals of participant suppression.
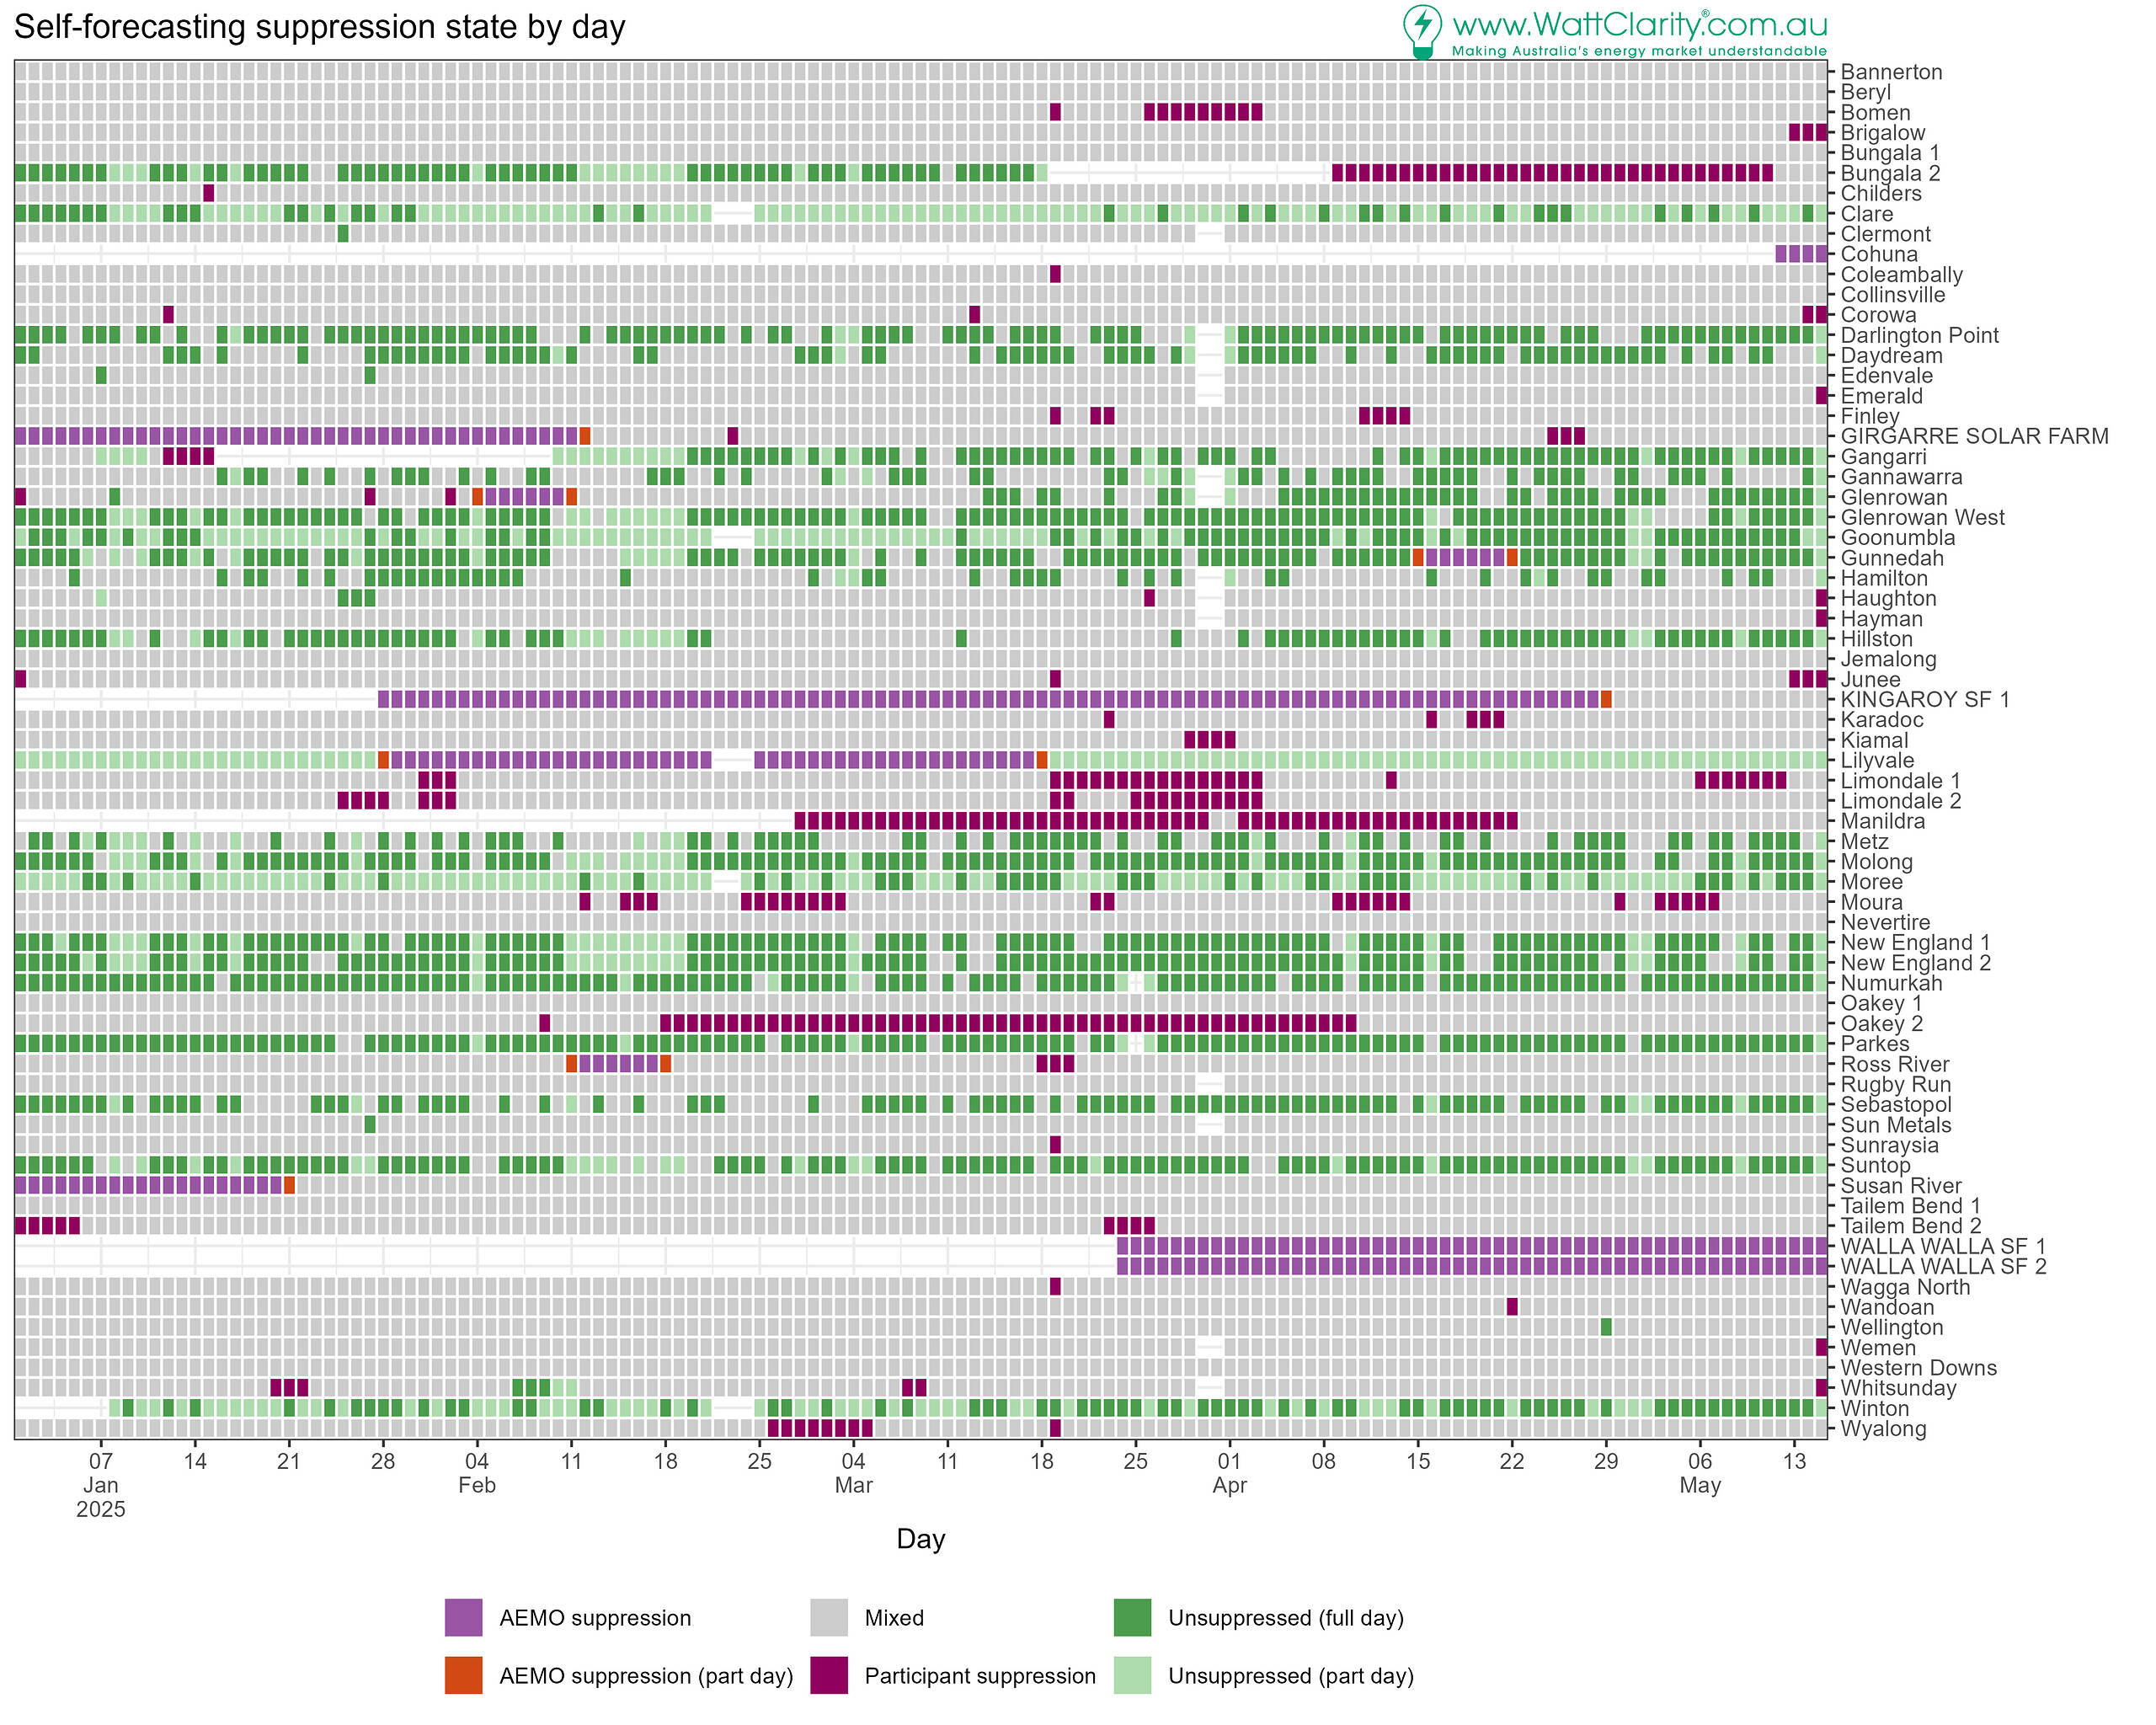
For the chart above, we categorise the self-forecasts of each unit by day.
- AEMO suppression is when the self-forecasts are all AEMO-suppressed for the full day.
- AEMO suppression (part day) is when there was a change in AEMO-suppression (either started or stopped).
- Unsuppressed (full day) is when there were 288 intervals where self-forecasts were unsuppressed.
- Unsuppressed (part day) is when there were less than 288 self-forecasts that were unsuppressed, and the other intervals in the day simply weren’t self-forecast.
- Mixed indicates the day saw forecasts that were at times unsuppressed and at times participant-suppressed.
- Participant suppression indicates that all self-forecasts in the day were participant-suppressed (and not AEMO suppressed).
More questions than answers
We’ve summarised how units are using self-forecasting to-date. As with the wind unit analysis many questions arise as to what this means for the future, two of which are:
- As the risk of greater costs to VRE units comes with FPP, can improved availability forecasts through the use of self-forecasting mitigate the risk?
- Is it possible we’ll see a jump in self-forecasting from the 47% level (for solar units) that we observe currently?
Editor’s Full Disclosure
| We (at Global-Roam Pty Ltd) have appreciated to be providing our readers with this WattClarity service for more than 15 years.
In early 2024 we were pleased to become a significant investor in ETSI, in order to assist it on its journey. This was also discussed in this review of our 25th year of our service. ETSI provides self-forecasting services to a growing number of Wind Farms. |
Be the first to comment on "Adoption and use of dispatch self-forecasting for solar units, Q1 2025"