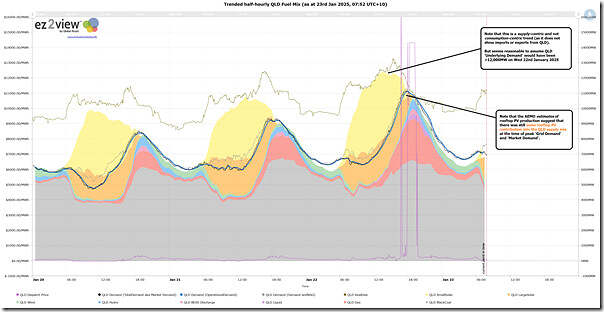
We’ve already noted how yesterday (Wednesday 22nd January 2025) saw a new ratchet up in the ‘all time maximum’ level of ‘Market Demand’ in the QLD region. Because I was curious, I accessed this pre-prepared trend chart in the ‘Trends Engine’ within ez2view to look at the trended half-hourly* fuel mix in the Queensland region:
>> * note that it’s half hourly, because the AEMO estimate for rooftop PV (see notes about opacity) is on a half-hourly basis, so we need to translate 5-minute ‘FinalMW’ data for the other fuel types to half hourly averages in order to stack.
For those with their own licence to the software, you can open your own copy of this trend here.
Quick notes:
1) Notwithstanding that this is a trend showing a supply-side perspective (i.e. not including imports and exports) it seems likely that the ‘Underlying Demand’ would have been above 12,000MW.
2) During the timing of peak ‘Market Demand that was the focus of articles yesterday, there was still some (maybe ~500MW and declining) contribution from rooftop PV at the time.


Leave a comment