Last Friday afternoon 13th December 2024 we wrote that ‘NEM-wide demand on Monday 16th December forecast to be highest in almost 4 years’. So I thought this morning we’d use a couple widgets in ez2view to take a look forward to the forecasts for Monday 16th December 2024 late afternoon and evening to see what’s changed …
Forecast Demand for this evening
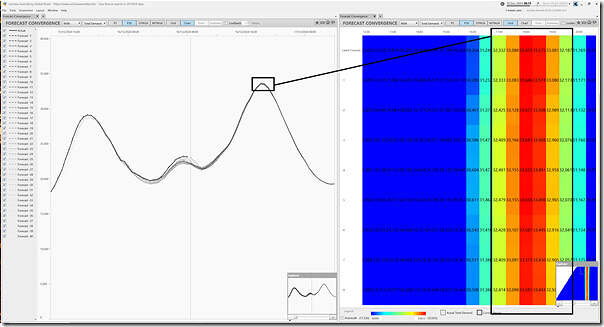
Utilising the ‘Forecast Convergence’ widget in ez2view at the 08:15 dispatch interval (NEM time) we see that the forecast peak in ‘Market Demand’ right across the NEM is still up at 33,653MW for the half-hour ending 18:00 (remembering Tripwire #1 and Tripwire #2 provide some details about what this data is actually representing):
Readers should recall that this widget (especially the ‘Grid’ view on the right) is designed so that the user can ‘look up a vertical’ in order to ‘see that other dimension of time’.
Forecast for Supply Options for this evening
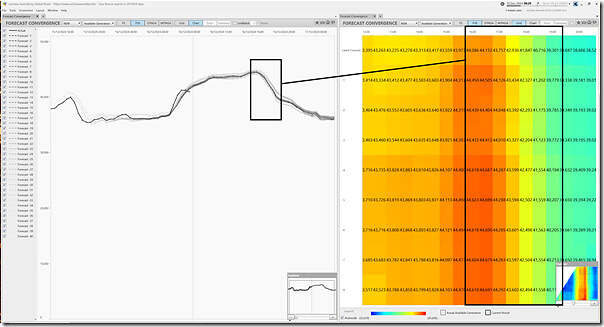
Switching the ‘Forecast Convergence’ widget in ez2view at the 08:20 dispatch interval (NEM time) to look at Available Generation, we see the following:
With respect to the grid view, we’ve highlighted the time range 16:00 to 19:00 which also covers the expected time of peak ‘Market Demand’ and we see:
1) Looking left to right, we see that the level of Available Generation declines into the early evening (coincident with the time when ‘Market Demand’ is forecast to ramp up.
(a) We can easily understand that part of this decline is due to the effect of sun setting on Large Solar generation sources across the NEM;
(b) But we’ll see below that this is not the only reason for the decline:
i. there’s one other that we have seen
ii. and there may well be more…
2) Looking from bottom to top, we also see that the numbers have also declined in successive forecasts.
So clearly, taken together, this evening is really going to be a ‘watch this space closely’.
Supply from Large Solar
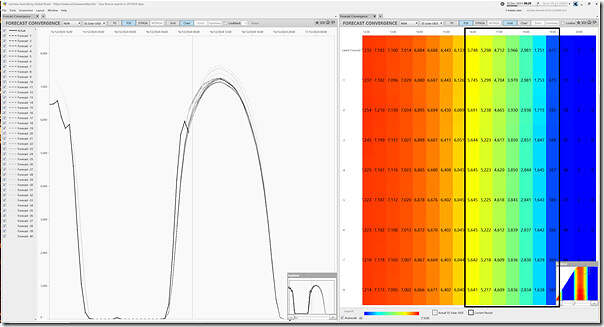
Flipping to look at the UIGF for Large Solar across the NEM (and remembering that the ’U’ stands for unconstrained) we see the following:
Looking in both directions in the grid, we see that:
1) Left to right there is the understandable decline into sunset, as noted above
2) Bottom to top, in this instance, there’s not a market into more recent forecasts (which is a good thing).
Supply from Wind
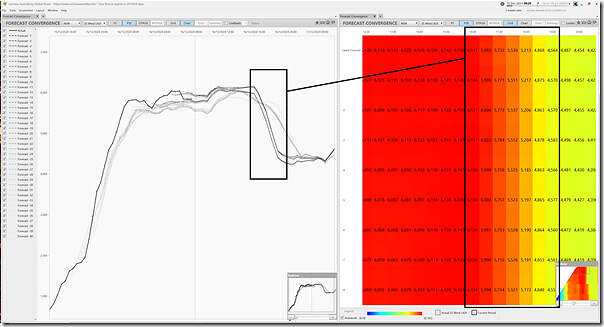
Flipping to look at the UIGF for Wind across the NEM (and remembering that the ’U’ stands for unconstrained) we see the following:
In this case here we see:
1) Looking left-to-right we see a sizeable decline of >1,500MW wind capability from 16:00 to 19:00:
(a) roughly coincident with when ‘Market Demand’ is climbing to its forecast peak
(b) that’s obviously unfortunate timing
(c) Note that we’ve not looked at the regional mix of this decline (where it occurs might be significant in terms of its impact)
2) Looking bottom-to-top, we thankfully don’t see any
LYA2 and CALL_B_1 back online recently
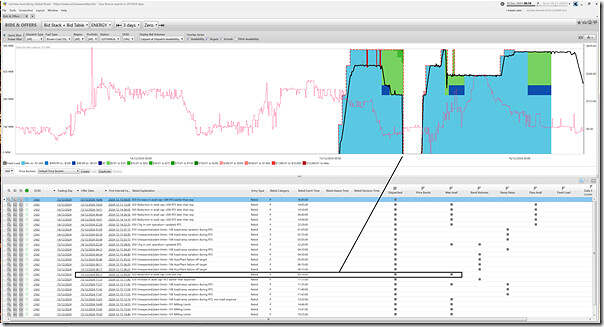
In some good news, we saw two coal units come back online over the weekend … albeit not without each experiencing some bumps in their return to service journeys. Using the ‘Bids & Offers’ widget, we take a quick look firstly at Loy Yang A2:
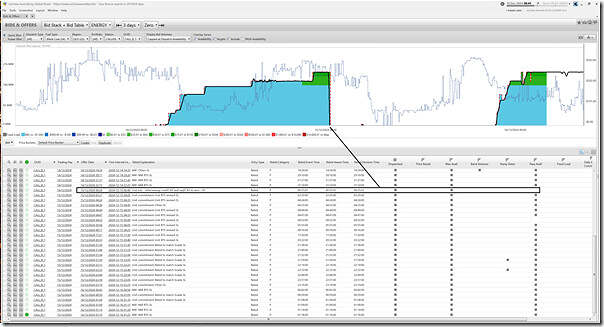
Now we look at Callide B1:
That’s all for now…


Leave a comment