Yesterday, amongst the volatility, we also wrote about a ‘Small (NEM Mainland) frequency wobble, on Thursday afternoon 7th November 2024’.
… we note that one reader (Ian McGregor) took issue with it being described as a ‘small frequency wobble’ – in this comment here – seeing that such a description diminished its significance, or seriousness.
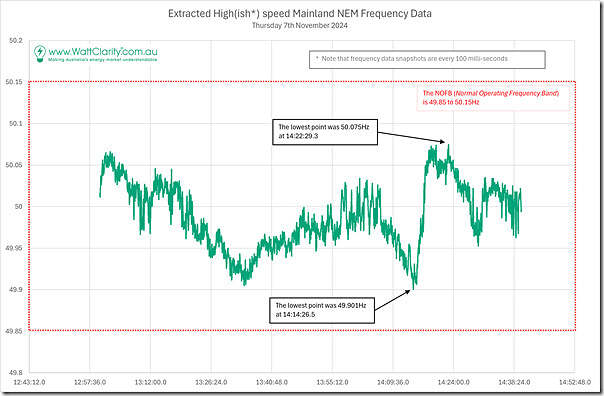
As a stepping stone to further analysis, we extracted data from around that time and present the two charts, starting with the entire extracted range:
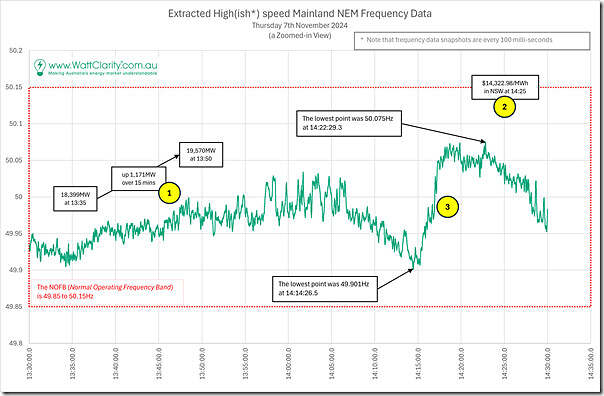
Utilising the extracted data to ascertain the specific time points and precise frequency readings, we’ve presented the following hour worth of readings (from 13:30 to 14:30 NEM time) to cover both of the events noted in yesterday afternoon’s article:
Event 1 = there was a the fairly steep afternoon ramp in ‘Market Demand’ across the NEM from 13:35 (18,399MW) to 13:50 (19,570MW) … i.e. 1,171MW over 15 minutes.
Event 2 = there was the price spike in NSW (to $14,322.98/MWh) as dispatch target for the 14:25 dispatch interval.
Event 3 = We can see in the following chart that the sharpest ramp up in System Frequency occurred in between those two Events … wholly within the 14:20 dispatch interval.
With those three events highlighted in time, in relation to NEM mainland frequency, we might be able to explore further … but not right now.


I think you and Ian are both correct. Extended cloud band playing havock with the system load, and a lack of system generation inertia. And for my 2 bobs, the almost constant mid daily state to state tie line constraints to near 0 MW transfers cant be helping either.