I should be focused elsewhere as there’s something I need to finish today – but a question kept bugging me, given what was noted in ‘Low, getting lower … AEMO’s forecasts for ‘Market Demand’ on Saturday 28th September 2024’ earlier this morning.
I wondered how the forecasted lowest point in the ST PASA run mentioned (i.e. 1,481MW for 12:00 tomorrow, Saturday 28th September 2024) would compare to the long-run trend of monthly minimum demand?
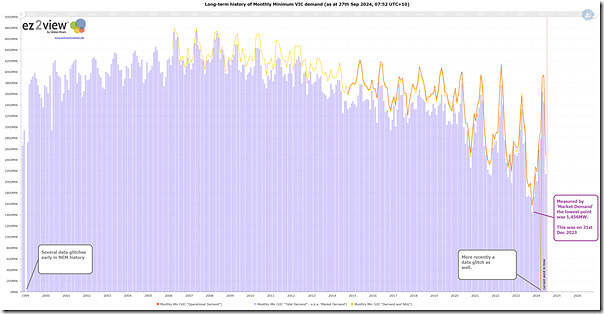
So I opened up a previously prepared query in the ‘Trends Engine’ within ez2view and updated the following long-range view:
So, briefly we note that:
1) In a historical context, the lowest point for ‘Market Demand’ was (by a fair margin) down at 1,456MW on 31st December 2023:
… as noted in this end-of-year summary, this was documented on that day via Part 1 and Part 2 and Part 3 and Part 4.
2) So the forecasts mentioned above (1,481MW at 13:00) would be just 25MW above that lowest-ever* point.
* yes, for the pedantic, ‘ever’ means in the history of the NEM (obviously not much electricity demand in the 1800s).
3) But it would also be 116MW above the MSL2 threshold the AEMO noted in that Market Notice, at which some actions might be triggered, perhaps?
So watch this space…


Leave a comment