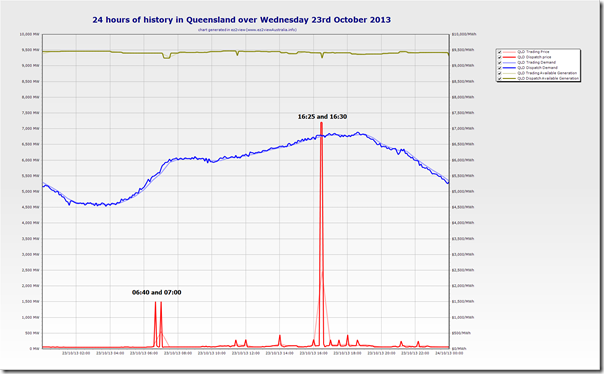
Following from Monday evening’s price wobbles, we saw more volatility yesterday in the Queensland region as shown in this custom chart generated in ez2viewAustralia:
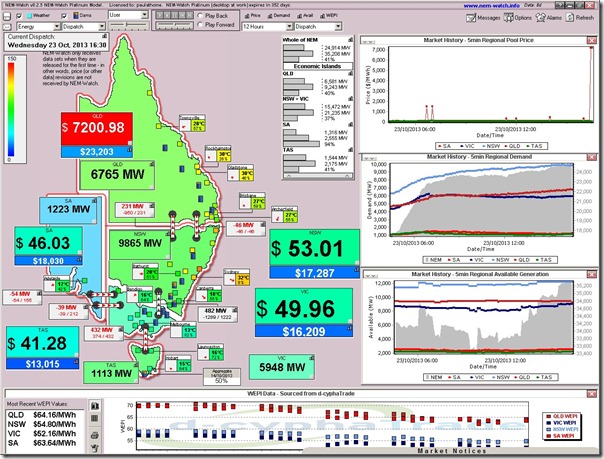
The largest spikes were in the evening, but note that there were a number of other spikes of various magnitude through the day. Here’s a record (from NEM-Watch) of one of the two largest spikes in the day – to $7,200/MWh at 16:30:
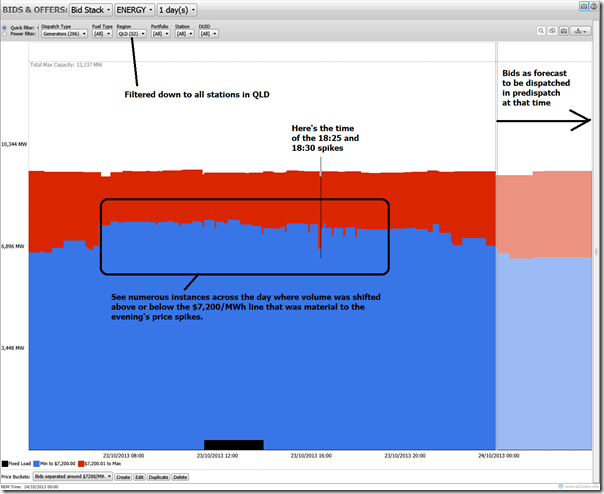
Here’s an intriguing view of bid stacks (from ez2viewAustralia) separated across the $7,200/MWh pricing that was material to the evening’s price spikes – showing how (at several times through the day) capacity was shifted above, and then back below, that price threshold:
We have not looked into the smaller spikes – but may do later, if time permits.


Leave a comment