I noted yesterday here that we continue to be interested in the prospect of (relatively rare, but very significant) ‘wind droughts’ into the future of the NEM … but we’re also interested in the high points and the averages as well.
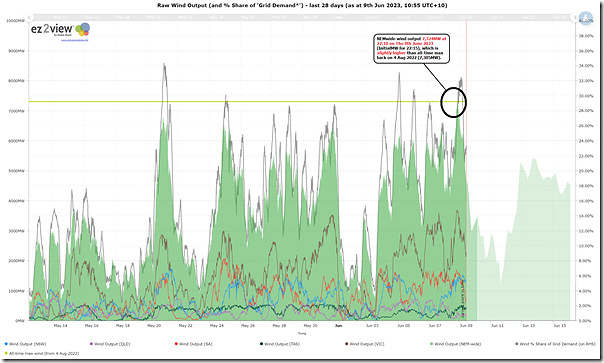
Coincidentally late yesterday the NEM-wide wind production reached 7,324MW metered at 22:10 on Thursday 8th June 2023 … which was slightly higher than the previous all-time NEM-wide record (at 7,305MW metered at 20:45 on Thursday 4th August 2022):
(Click on the image to open in larger view)
(A) Recent data
As noted on the image, we see the share of ‘Grid Demand’ for wind at the time was up over 30%.
Indeed, since the lull last Saturday evening 3rd June (down to 770MW … ~10% of the new maximum) it’s been fairly consistently gusty.
(A1) Operational Challenges
The high wind speeds are not without their own challenges … not just in terms of localised distribution network outages, but also from a more macro perspective – such as in the ‘Protected Event’ that the AEMO needed to declare on Wednesday 7th June for South Australia:
——————————————————————-
MARKET NOTICE
——————————————————————-
From : AEMO
To : NEMITWEB1
Creation Date : 07/06/2023 12:24:25
——————————————————————-
Notice ID : 108385
Notice Type ID : PROTECTED EVENT
Notice Type Description : Protected Event
Issue Date : 07/06/2023
External Reference : Protected event advice – South Australia region.
——————————————————————-
Reason :
AEMO ELECTRICITY MARKET NOTICE.
AEMO has identified that the conditions of the following protected event will be met from the time specified in this notice.
Protected event: the loss of multiple transmission elements causing generation disconnection in the South Australia region during periods where destructive wind conditions are forecast by the Bureau of Meteorology.
Duration: 07/06/2023 1230 hrs until further notice
AEMO will take action to manage the power system for the impact of the protected event.
Constraint set invoked: I-VS_250
Manager NEM Real Time Operations
——————————————————————-
END OF REPORT
——————————————————————-
This Protected Event was later cancelled
(A2) Surprised on the upside?
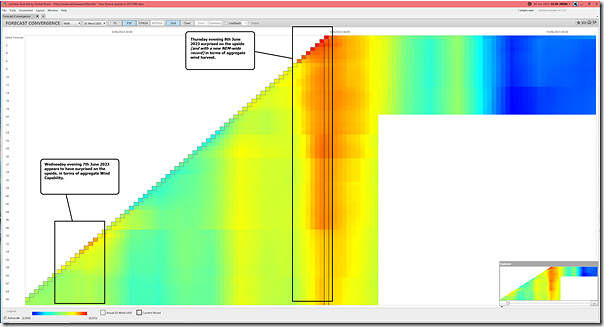
Given that the ability to use ‘Forecast Convergence’ widget in ez2view for NEMwide totals of some metrics was added into the v9.6 release, I thought I’d have a look at successive AEMO aggregate UIGF (Unconstrained Intermittent Generation Forecast) on a NEM-wide basis here:
Remembering that this widget allows the user to ‘look up a vertical’ to see ‘that other dimension of time’ we can clearly see some strong indication that the actual yield surprised AEMO on the upside. This was also the case on Wednesday evening around the same time.
Given that we’ve been tracking the statistical ‘Forecast Convergence’ performance for Wind UIGF* in the GenInsights Quarterly Updates (most recently with the GenInsights 2023 Q1 update) it’s no surprise that these instances occur … wind also does tend to surprise on the downside on occasions, as well.
* note in the GenInsights Quarterly Update we track Forecast Convergence for many different metrics.
(B) Longer-term trend
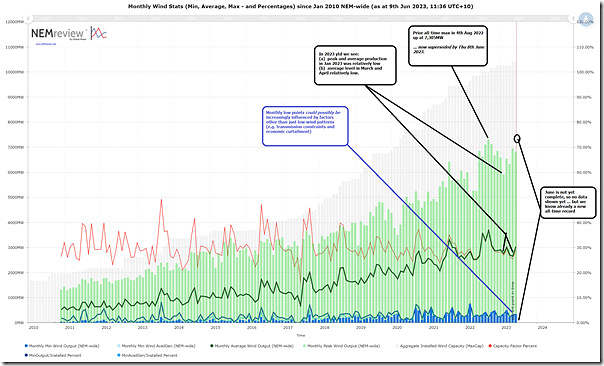
Putting this new peak in context, here’s a longer-term trend of monthly headline statistics for NEM-wide wind production:
This one is more of a backwards-looking trend that’s also accessible in NEMreview v7.
1) We can see that January 2023 was relatively low compared to the surrounding months (though still an increase on the low points till the start of May 2022 leading into the 2022 Energy Crisis).
2) With respect to the monthly low points, keep in mind that these could be increasingly affected:
(a) Not just by periods of low wind capability;
(b) But also by transmission constraints causing curtailment; a
(c) And also by economic curtailment with negative prices during high solar yield periods (something we’ve noted, for instance, in GenInsights Quarterly Updates in that the spot market is commercially driving more diversity between wind and solar yield shapes, which could be misinterpreted by those doing rushed analysis).
With all the new capacity that’s been added in the past 12 months we’d be expecting that record to nudge higher in the next 3 months as we roll through the traditional ‘windy season’.
Readers with their own licence to the ez2view software can keep an eye on the same representation above, via this live-updating Trend Widget in their own browser (or in the installed copy of ez2view). The faded green shape out to the right of the ‘now’ point comes from AEMO’s forecast for UIGF for Wind through P30 predispatch into ST PASA.


We almost need to have capacity adjusted records to understand how good were the actual wind conditions at the time.