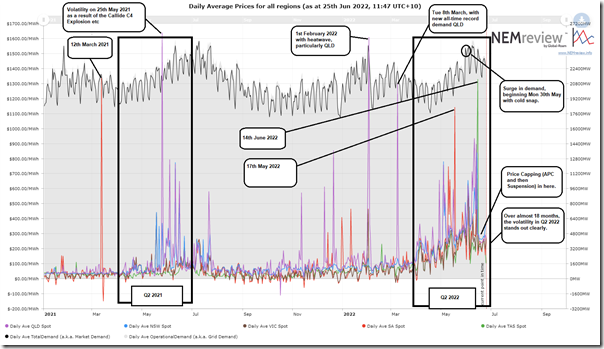
The market’s been unsuspended for just under 24 hours and I thought today I would start by taking a quick look back over the pattern of volatility across all regions using NEMreview v7:
Those with a licence to the software can open their own copy of this query here.
I’ve annotated the chart with some of the significant events that occurred through this period – but clearly the main observation to make (in terms of spot price outcomes) was:
1) that there was a clear step in prices into Q2 2022 beginning right at the start of the quarter
2) and which escalated further through the quarter.
With respect just to prices, we’ll explore these in more detail in early July when the quarter’s fully finished and we get to updating this analysis of prices for Q2 2021 … with a methodology we’ve been running for a number of years.
—
It’s no surprise that there have been a number of market bodies announcing that they will conduct some very necessary reviews … :
1) I hope that these will focus more broadly on the whole of this ‘2022 Energy Crisis’ … including factors that we probably should/could have predicted better in advance
2) Rather than just focusing more specifically on the recent 2-week period covering the Administered Price Cap and Market Suspension.
In parallel with these formal reviews, we’ve already been posting about a number of the factors contributing to the outcomes of this ‘2022 Energy Crisis’ and will continue to progressively work through these here on WattClarity®.
—
Much has been written (including on WattClarity) about two of the most significant factors contributing to this ‘2022 Energy Crisis’:
1) Coal-fired unit outages; and
2) High fuel costs.
… however my sense is that this has come at a cost (which may be to our longer-term detriment) in that a number of stakeholders have begun believing that there are only two factors.
It’s my clear view that, unless we think more broadly about all of the factors contributing we’ll be short-changing ourselves in terms of informing changes necessary to ensure this energy transition delivers on the implicit (and explicit) promises made to all of us.
It’s that breadth of consideration is what we’ll be striving to add to in the weeks and months ahead.


Hello Paul,
How about its also been pretty cold for broad areas for long periods, low winds, the snowy hydro not running properly, high gas costs, high coal costs, water sodden coal mines restricting supply, gas supply tight, very run down coal plants, and I am sure gas plants, poor planning, bit of gaming the bidding system?, and i am sure a bunch of others i have missed. All in all a fair amount has gone the wrong way all at the same time.