As of Thursday 10th May, AEMO has moved from a deterministic to a probabilistic method for forecasting the likelihood of Low Reserve Condition (LRC) over the forecast time horizon within MT PASA. In principle, this should mean a more precise modelling result – which should mean lower cost to the market, both in terms of:
1) more tailored market response to any forecast Low Reserve Condition at some point in the future; and also
2) more targeted procurement of emergency reserves (like through the RERT) if it is deemed that there is a “market failure” and that the AEMO needs to intervene.
Of course, I have previously noted how forecasting is a difficult art (though I did not use those exact words), so we will keenly watch to see what unfolds in practice.
(A) Helping clients to understand MT PASA through our ez2view software
Our ez2view clients (being ones with significant exposure to the market in some way – either as physical/financial traders, or in some other role) are also keenly interested in the new MT PASA data sets. We understand this, so we let them know earlier that we have been working down the path of upgrading our software to help them make the most of the opportunities apparent in the forecast runs – both currently, and as forecasts change through the weeks (or every 3 hours).
This post will also help, as we know the battle of the full inbox.
If you’re a client (or want to be) and would like to work with us in this discovery and development process, please give us a call on +61 7 3368 4064.
(B) Helping a broader audience make sense of the new MT PASA data
We’re still undecided about how much we should be doing in this respect.
I must admit to being more than a little disheartened by what seems to be a rapidly escalating tendency in the broader energy commentariat to misread (and it seems, at times, to wilfully misrepresent) the meaning of the data that was presented in the MT PASA data the AEMO used to publish. Contrary to what seems like popular belief in that respect, the primary purpose of AEMO’s forecasts (MT PASA and other) is and has always been to elicit a market response – not to promote cries of “the sky is falling”.
We note that some of the new data sets & visualisations are not currently publicly available and we know that it’s an area of flux currently, so will take our time to think through anything we do publish more broadly.
We have already incorporated some of the key data sets into the “Trend Engine” Widget within ez2view, and also available at ez2view online here:
https://app.ez2view.info
(clients can log in with their work email address)
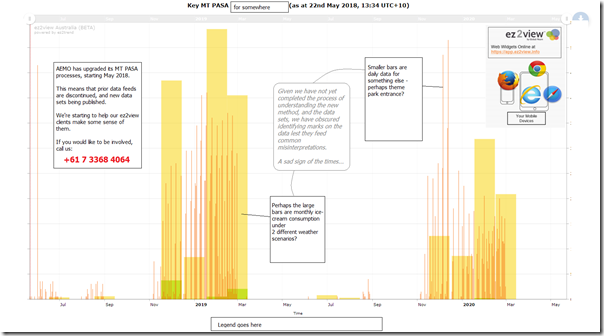
Some of the current data is shown here for a randomly selected region:
You’ll note that I have masked some identifying details in the chart, in what is perhaps a fruitless effort to prevent certain sections of our readership (e.g. those at either ends of the Emotion-o-Meter) from running off on their tangents.


Be the first to comment on "Helping our clients make sense of (and grasp the opportunities in) the AEMO’s new MT PASA data sets"