With the North American solar eclipse of 21st August 2017 setting some packets of social media alight (and even rating mentions in the Fin Review (and this one copied over from Reuters), along with the Australian (but not much about power!), RenewEconomy and the Conversation) it triggered some thoughts I’ve tried to post below.
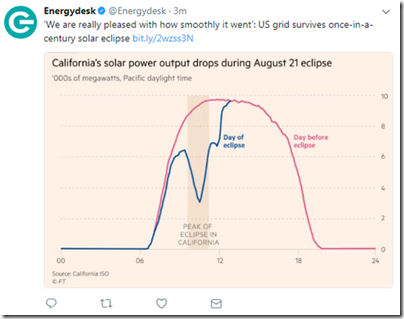
I also particularly noticed the tweet above, which quoted this article in the Financial Times and looked particularly at the Californian grid, despite* the fact that the eclipse was more severe in other parts of North America.
* I presume (some of our more knowledgeable readers might like to confirm) that the focus on California might have been because of a combination of a number of factors including:
Factor #1 = easier availability of data (though we note we have sourced better data for other parts of North America);
Factor #2 = higher penetration of PV (which the article from the Conversation, also linked above, seems to support – noting that “last year 10% of the state’s electricity came from PV”, from which I infer the author meaning annual energy, implying peak supply much higher than 10%); and
Factor #3 = higher level of interest (given size of demand, the sustainability policies in place, and general focus on innovation);
Factor #4 = possibly a likelihood of clearer skies across California might have been a factor (thanks, Shane, for suggesting that one).
Thinking through this today (and following coincidental conversations with a client or two) it seems to me that there are a number of challenges at work, here:
Challenge #1) Intermittency delivers challenges over several timeframes
Australia has not been subject to a similar eclipse, yet – though there is certainly awareness of that there’s a challenge coming down the line for us on 22nd July 2028.
(a) That’s 11 years away, however, so plenty of time to plan for it (and, of course, to read about it afterwards on WattClarity – though there might be a different author writing by then…)
(b) As I noted to some clients I was speaking with about this today, if all the engineers in the Californian electricity supply industry (or Australia as well) can’t keep the lights on for a one-off event known years in advance, then that would be a massive indictment. Hence it’s not really a surprise that everything went well in California this week (or in Germany a year or so ago).The event does flag a number of things that are much more challenging, however:
1a) Ramp rates, on a minute-by-minute timescale
Giles’ article on RenewEconomy does flag that the real challenge of this week’s Eclipse in California was that it would massively increase the ramp-rate requirement of the back-up generators called on to meet the “net demand” requirement as the solar faded quickly, and then back off again as the system ramped up – noting:
“California was preparing for ramp rates of twice the normal experience, from its average 29MW a minute to double that and a peak of 98MW a minute.
In the future, when California reaches its 50 per cent renewable energy target by 2030, and its 100 per cent target by 2050, those ramp rates will be even more impressive. Storage, demand management, smart controls, and back-up will play a critical role.”
With respect to ramp rates, my sense is that it’s not so much a technical challenge as one involving economics, market structure and regulation – how to ensure that we have fast response capacity incentivised to enter the market at least cost.
1b) Scheduling and operations, on a day-to-day basis
It did not take long this morning to see that the NEM has already experienced a number of significant drops in aggregate small-scale solar PV, right across the NEM. With current levels of PV installation (only about 4,000MW from memory) these are of marginal significance currently – but the significance will ramp quickly as the roll-out of PV continues into the future (with installation of commercial PV apparently in a sweet spot at present).
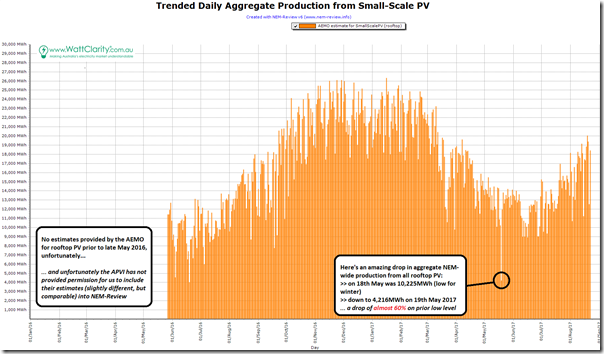
Using NEM-Review v6 , for instance, I’ve quickly generated this trend of aggregate daily output of the AEMO’s estimates for small-scale PV on a region basis (in this case aggregated up to NEM-wide).
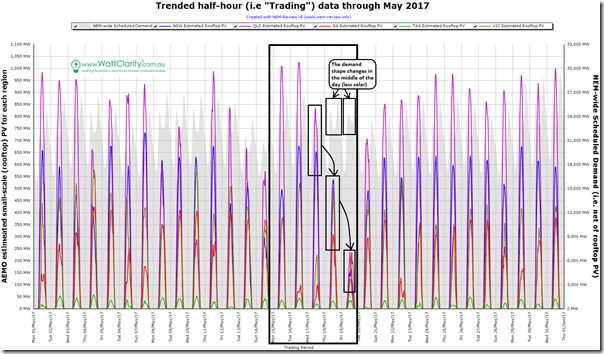
As noted on the image, we see a staggering 60% drop in aggregate output NEM-wide from 18th May to 19th May 2017 (that’s off an already low base the day before). Being a data junkie, my first thought in reading something like this is always “potential data error?”, hence I delved deeper into the half-hour data for May, and separated out each of the regions to produce the following chart, again with NEM-Review v6:
As can be seen, the estimated output for both QLD and NSW (the biggest regions, in terms of contributions) had been declining progressively from Tuesday through to Friday 19th May. Victoria and South Australia seem to have a different pattern.
Whilst the output is not seen to drop for Tasmania on Friday (it increases on Friday, and then reduces very low on Saturday) it’s off a very low base. Given population of Tasmania, and latitude, I suspect that Tasmania is unlikely to account for much in terms of percentage share of solar PV (no offence intended to our Tasmanian friends).
1c) Planning and development, on a longer-term basis
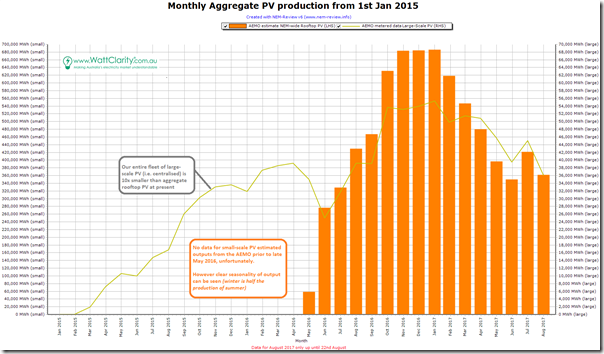
Over a longer time-frame, there are other challenges – related to planning for, and development of (including ensuring correct economic signals for) the right type of capacity to help keep the lights on when the sun’s not shining so brightly. Chunking the above data in NEM-Review v6 up to months, and throwing on data for our entire fleet of large-scale PV as a useful comparison (on the right axis, 10 times smaller currently) provides a useful illustration of the seasonality:
As can be seen, winter solar harvest is only half as effective as summer harvest (perhaps less, keeping in mind installations increased from January to June 2017).
Challenge #2) Prediction, or anticipation, is a factor
It’s not like the North American eclipse of 21st August was not expected. As noted above, we should be expecting smooth sailing from our market/network operators in cases like these.
It’s the unpredictable events that we should be more wary of, and devoting more attention to (though perhaps not as snazzy a photo opportunity) – like where the wind went during May-June 2017, and the remarkable (but hitherto not remarked on?) drop in output through to Friday 19th May 2017!
That’s why I am particularly interested to watch innovations such as what AEMO is doing with ASEFS and AWEFS, and what other providers (like SolCast, and others we’ve heard about) are developing – they will be a major part of meeting the challenges ahead.
Challenge #3) Access to real data is a significant challenge
In Giles’ article on RenewEconomy he notes that the majority of PV installed in California is large-scale solar, with the inference being that these systems provide much better real-time data – which would certainly have helped the California ISO in its role of “keeping the lights on”. Given the 10x difference here between small and large (currently, though plenty of projects being added to our Generator Catalog as they pop up!) in the NEM, this would be a much harder job for the AEMO, all else being equal.
I’ve already posted about “the Opacity of rooftop PV”, as one aspect of a broader challenge with Distributed Energy Resources (and have noted elsewhere how we’re working to assist in the challenging space of data about distributed battery storage systems).
PS – oh, I forgot to mention that (as we are, at home, the very grateful recipient of a long-dated and hyper-generous 44c FIT for our 5kW system at home + being a data junkie and working in the space) I am a keen watcher of my own output.
(a) To date I’ve been using PVOutput for the purpose, but have found the data a bit flaky (a growing number of gaps, which have been explained to me as changes to HTTP protocols);
(b) Hence have recently signed up to a better offering from Solar Analytics, using the WattWatchers gadget – however been having some teething problems with that.Update from Tue 7th November
On Tuesday 7th November I have posted some initial musings about my own rooftop solar learning exercise.Another example of the challenges of getting data about distributed resources. Will hope to update you with more details later, when the teething problems are all sorted…
Apologies, that’s all the thoughts I‘ve had time to post today – check back on WattClarity later for other articles…


Leave a comment