Given I’d previously posted these comments back in March, which had been subsequently picked up by a variety of people in the media, it was no surprise that I fielded a few questions following the release of an Energy Quest claim that the cost of the Tasmanian crisis had reached $560M (quoted in The Age here and probably elsewhere as well).
I thought it more efficient to provide an answer as a generally-available post today.
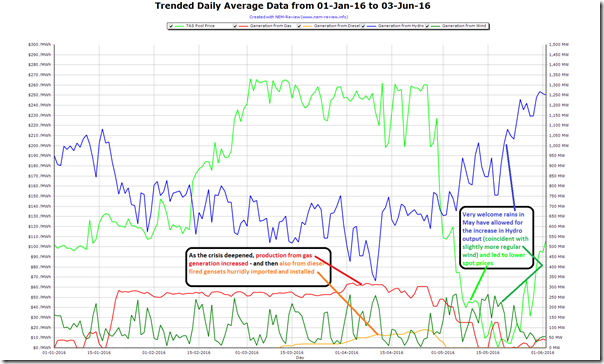
Using NEM-Review we can produce this recap of the average daily position of Tasmania from 1st January through until this morning:
In terms of the “cost” of the crisis, readers will understand the impossibility of truly answering the question – because of the need to compare “what is” with “what would have been” (where, especially in such an interconnected market as the Australian energy market, it’s impossible to know the truth of “what would have been”).
As a general guide, however, one might take the approach I took back in March – ascribing some “uplift” on the cost of energy in the Tasmanian region of the wholesale market over the period, compared to some historical reference.
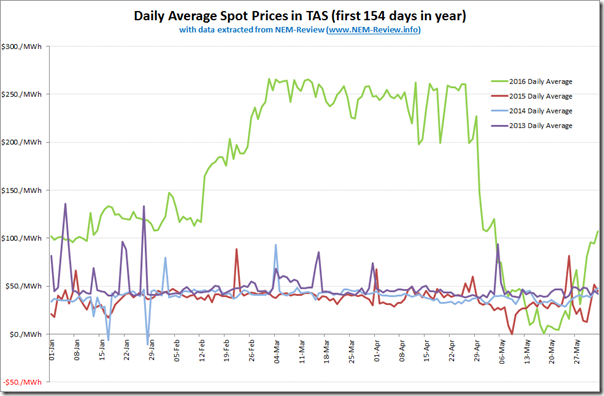
Hence with NEM-Review again we accessed half-hourly spot prices for the 154 days from 1st January 2016 through until the end of the day yesterday, and compared this with prices for a similar* 154 day period in 2015, 2014 and 2014 – revealing the comparison below:
* note that the data is for a slightly different 154 day period, date-wise, because of the effect of the leap year.
Clearly there is a big difference!
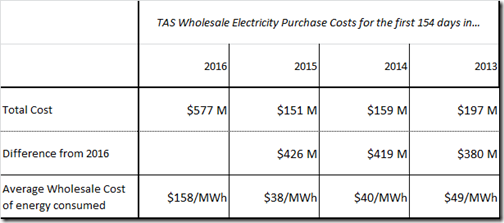
Multiplying the half-hourly spot prices by the consumption over that 1/2 hour period in each of the 154 day data sets reveals this comparison:
Note that this amount would not include a number of other factors, including the cost (short-term, and long-term) of lost production at the major energy users who agreed to curtail in order to do their bit to conserve precious water supplies (which we termed “an unwanted form of Demand Response”) and also the opportunity cost of the energy not consumed by all the other smaller Tasmanian companies and households doing their bit in the same circumstances. Also, the people at Energy Quest will be better placed to understand what flow-on effects might have been felt in the gas market as a result.
Hence the $560M number from Energy Quest is larger than the numbers in the table shown above – but not orders of magnitude different. Whatever the cost actually turns out to be (not that anyone will ever know, in totality), it’s significant.
As I noted last time, calculating the cost is one (difficult) task – understanding who’s actually incurred the cost and in what proportion is something altogether different (even more difficult).


Economists normally value the impact of such an event from the “resource cost” implications, i.e. the additional input costs to the industry (such as fuel and hired plant), plus the forgone value of any lost sales. For an event like this one, the resource costs will be much lower than simply multiplying the marginal spot price inflation by demand.
Thanks Ben
Your comment reminds me of the distinction between “Market Benefits” and “Customer Benefits” that have perplexed many who’ve looked to justify an upgrade of QNI over the years through the Regulatory Test.
I appreciate the distinction you make, however believe that the broader community will think of the cost of the Tassie crisis in terms of increase in costs paid collectively – independent of whether an economist might class some as “wealth transfers”.
Paul
Ben’s comment about resource costs is well made (as is Paul’s about the opportunity cost of consumption foregone by customers who reduced their usage). The other thing to remember about simple spot price (uplift) x volume calculations is that they miss the impact of financial contracts between buyers and sellers (predominantly Hydro Tas) which would substantially mitigate the net purchase payments of buyers. In looking at the effective additional financial cost to buyers (as a whole) one would really need to know their netspot electricity exposures and multiply those significantly smaller volumes by the assessed spot price increase. Of course there is no publicly available data on the size of these net exposures but it would be safe to assume that they are much smaller than gross demand volumes.