LNG production is now a reality and will become a significant market feature, influencing both the gas and electricity landscape for the next 20 years and potentially well beyond.
In December 2014, the first Queensland LNG cargo was shipped by QCLNG; GLNG shipped its first cargo in October 2015 and APLNG’s first cargo is expected later this year.
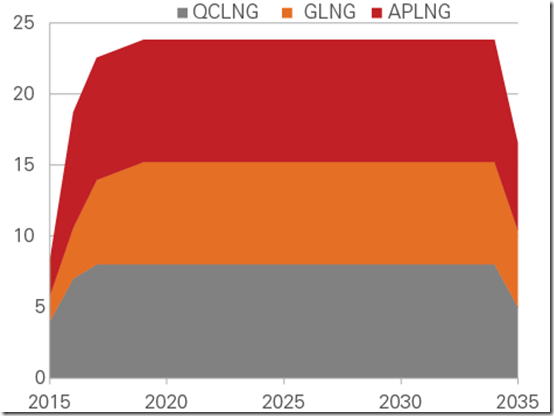
The three committed LNG projects involve the development of six LNG trains on Curtis Island, North East of Queensland by the end of 2017/18, totalling ~25Mtpa of liquefaction/processing capacity.
Figure 1.1 presents the profile of contracted LNG exports for each LNG project. There is a period between 2015 and 2019, where trains 1 and 2 of each project ramp up production to achieve an estimated plateau contracted volume of ~24Mtpa of LNG.
Figure 1.1 Contracted LNG Exports | Mtpa
Source: Core Energy Group, 2015
Once the LNG sector reaches maturity it will account for approximately 70% of gas consumption in eastern Australia and up to 20% of Queensland sent out electricity.
Electricity Consumption in the LNG Value Chain
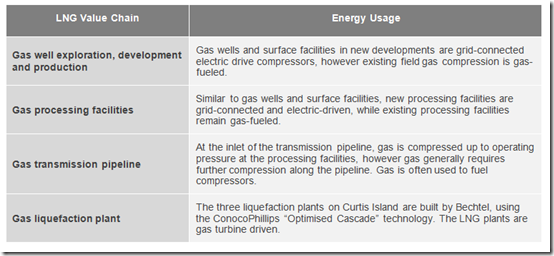
The LNG value chain consists of four main segments, illustrated in Figure 1.2. The energy usage on each segment of the value chain is detailed in Table 1.1.
Figure 1.2 LNG Value Chain
Source: Singapore Power Group
Table 1.1 LNG Value Chain & Energy Usage
Upstream gas field and processing facilities is the major user of grid-electricity along the LNG value chain. As a rule of thumb, AEMO and Lewis Gray Advisory have assumed that electricity usage in the gas field and processing plant is on average 2.66% of total gas produced. This equates to just over 10,000MWh p.a. or ~38 PJ p.a. of ~1,450 PJ p.a. LNG gas production at the field, when all six trains reach contract-level production.
Impact on Queensland Electricity Consumption
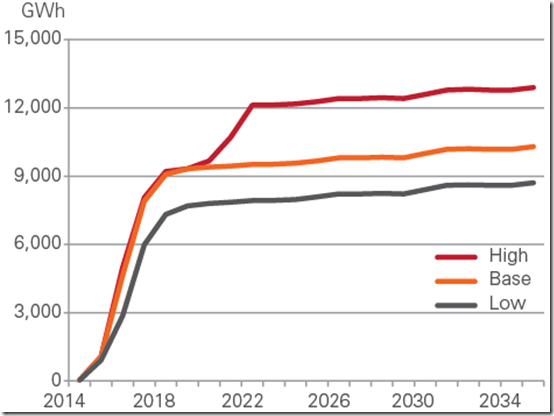
Based on AEMO projections, electricity consumption in Queensland is expected to grow by almost 10,000GWh p.a. or ~20% by 2020 once all the LNG trains are fully commissioned.
Figure 1.3 presents AEMO’s low, base and high case for NEM electricity consumption by LNG projects.
Figure 1.3 NEM Electricity Consumption by LNG Projects
Source: AEMO & Lewis Grey Advisory, 2015
Editor’s Note
This week we’re publishing a number of different perspectives of various factors contributing to what peak demand might be – NEM-wide, and for each region. Apart from being generally of interest (peak demand being a key driver of costs, in the energy market and on the network side) we’re providing another reason to be interested, this week.
Entries close this Friday (27th November) for your own chance to win one of 7 BBQs in WattClarity’s Peak Demand Forecaster Competition.
About our Guest Authors
|
Zhi Oh Paul Taliangis |
Paul Taliangis is Managing Director, and Zhi Oh is Team Leader, at Core Energy Group.
Core Energy Group is a specialist energy advisory firm with a particular focus on gas, LNG, power and infrastructure elements of the Australian energy industry value chain. Previous articles from Paul Taliangis can be found on WattClarity here. Connect on LinkedIn with Paul here, and with Zhi here. |


Not sure the LNG sector will consume 20% of QLD’s electricity given that the three downstream plants on Curtis Island and GLNG upstream have their own gas turbines and are not connected to the grid
The LNG plants will certainly have their own off grid power for liquefaction process. I think the is expectation that some of the power required for upstream gas production and transmission may be taken from the grid.