A week ago, I posted these initial results of some modelling I have been doing to help me get my head around what the world* might look like in a future (undated) environment where significant capacity of intermittent generation is present – 10 times the capacity installed for time series production levels seen for every 5-minute period through financial year 2014-15.
* the world – or at least the Australian National Electricity Market (NEM)
Given the NEM has (roughly) 3000MW of solar PV capacity installed at present, this means an assumption of 30,000MW of solar capacity in this hypothetical future world. I note this is a more bullish scenario than any of the AEMO scenarios used in the 2015 National Electricity Forecasting Report (though still not as bullish as some industry stakeholders are calling for). There’s also a big uplift (10x) in the capacity of wind assumed.
A key point noted in the first piece of analysis was that, as penetration rates climb the energy generated, still being concentrated in the sunny or windy times (all else being the same), becomes so large it’s surplus to total consumption at that time – and hence spills.
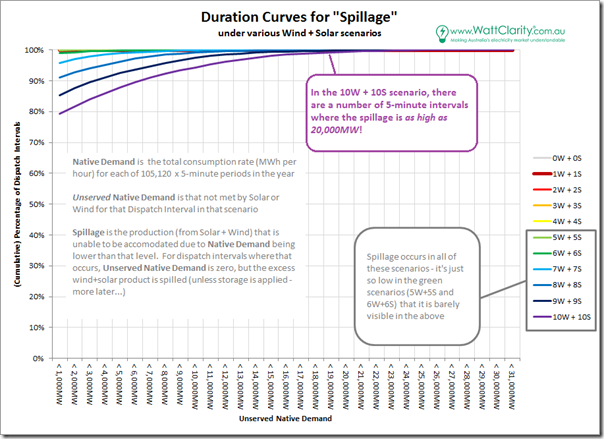
The aggregate duration of this spillage is shown in the image below:
Hence we note (with reference to the table in my prior post) that the 10W + 10S scenario would deliver a total of 66% total consumption across the year from intermittent sources (wind and solar). That’s the “glass half-full” perspective.
The “glass half-empty” perspective is that this would result in some periods where spillage is as high as 20,000MW, and (in total) where there is some amount of spillage 20% of the time.
I posted an animation recently of yin and yang of wind in South Australia (currently). The above is just another example – albeit on a much larger scale – of the swings and roundabouts of intermittent generation sources.
That’s one of the challenges the NEM would grapple with in accommodating a massive increase in renewable generation based on a simple extension of the current form of the RET (i.e. which is currently providing only two forms of generation – solar and wind – because of their cost advantages over other forms, some of which might be more controllable (or, at the very least, operate on a different intermittency pattern)).
Increasing amounts of spillage could act to change the economics of all installed generation sources, and in particular all pre-existing intermittent sources:
1) These intermittent sources are paid (through the RET) on the basis of volume generated, irrespective of time or place, hence lower volumes (imposed by spillage) mean lower revenue;
2) Furthermore, when 100% of consumption is being supplied by intermittent sources, which particular wind or solar plant are told to – or decide to – turn down? Would it just be “last man standing” as the spot price threatens to go more negative?
We’re already seeing larger shares of wind production in South Australia meaning SA wind farms are collectively shooting themselves in the foot because of coincident high volumes.
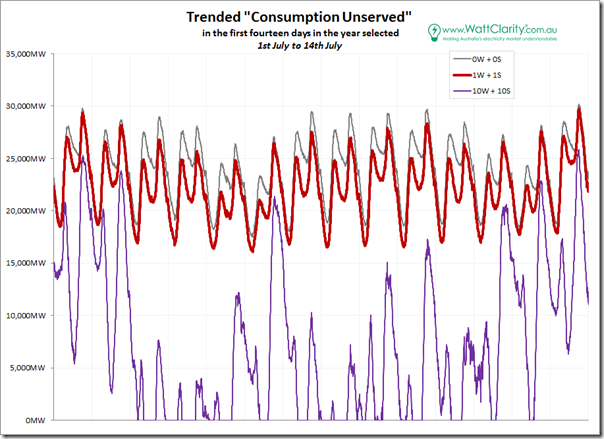
To make these duration curves more understandable to a broader audience, I’ve pulled out the first 2 weeks of the year in question and highlighted them in charts below:
We can see that peak “net demand” is still aligned with evening time – i.e. there are still evening peaks in this “consumption unserved”, which (especially during the winter weeks above) would be when solar output has fallen to zero. This “consumption unserved” is what the AEMO would be focused on in dispatching other plant to keep the lights on.
However any thought of being able to differentiate weekday or weekend demand profiles just goes out the window. The difference from one day to the next results from how much the wind was blowing.
What’s particularly of interest to me is that the “peak” is much, much peakier in 10x than it is in 1x – i.e. the concept of base-load demand just does not exist anymore.
This is a key point, so just to be clear:
1) In the 0x scenario above, demand varies from a low of about 17,700MW to a high of 30,200MW (a difference of 12,500MW)
2) In the 1x scenario, demand varies from 16,100MW to 29,700MW (a difference of 13,600MW)
3) In the 10x scenario, demand varies from 0MW to over 25,000MW (a difference of 25,000MW).
The move to a “peakier” demand shape is already happening and peaks will amplify as more intermittent supply is layered into the energy supply mix.
This trend should not be confused with other changes that are occurring with respect to maximum demand. Frequent readers of WattClarity will note that we wrote about this after summer 2014-15 for the whole NEM, and separately for QLD, NSW, VIC, SA and TAS.
At the same time, it means the need for (and hence value of) responsive “peaking” capacity (in some form) would become magnified significantly.
In a “traditional” electricity supply industry there has essentially been two choices of plant to deploy:
1) Plant with high capital cost ($/MW installed), but low operating cost (incremental $/MWh produced) is best run as much as possible in order to amortise the higher capital cost over higher production volume. This plant has become known as “baseload generation” – whereas it’s my understanding that “baseload” was originally a label applied to demand, rather than supply.
2) On the other side of the equation we have plant with smaller capital cost ($/MW installed) but higher operating cost – because of lower efficiency, intrinsically higher priced fuel (e.g. gas instead of coal) and also uncertainty about production volumes (and hence inability to negotiate cheaper fuel supply arrangements – a problem increasingly facing the South Australian region at present – for instance). These plant became known as “peaking” plant.
Because they were the two choices available (and deployed), it was a happy coincidence that development on the consumption side of the equation could follow in a similar way – hence we arrive at the current point where we have major industrial loads (not just in Australia but around the world) designed with high capital cost and (relatively) low operating cost, incentivising them to “run flat out”.
In the new electricity supply industry we’re moving into, the neat categorisation of yesteryear no longer applies. For instance, the solar and wind capacity that features heavily in the 10x scenario are both high capital cost ($/MW installed) – indeed, higher than coal – but very low (though still not nil) operating cost. Hence based on those two numbers they would fit the “base-load” label, but are physically incapable of running all the time.
As we move into this new environment in electricity supply, does this also signal a transition (which might take decades) for industrial facilities that are also more “peaky” in nature to correspond with what might be – in this scenario – a distinctly more intermittent nature of supply.
Remember that these scenarios (whilst the multipliers are hypothetical) are based on real historical numbers for consumption, for solar and for wind output. They are also scenarios that are plausible under a “more of the same” assumption – which is what, it seems to me, is likely to happen unless some change in policy incentive is implemented and/or a major shift in relative cost structures of other renewable sources occurs relative to solar and wind.
Under these scenarios (where gross consumption is assumed to be the same as it was in 2014-15), it’s clear that “something else” would need to be called upon to fill the gap when the sun’s not shining and the wind’s not blowing. Prudent risk management would call for that “something else” to entail multiple types of technology. Experience suggests that this “something else” might fit into three general buckets:
Bucket 1) Storage is certainly flavour of the year, with all the buzz about Tesla and so on… but it’s important to remember that pumped storage hydro has been available for decades – and I have seen at least one proposal for a sizeable addition to that fleet.
Bucket 2) Demand Response is my particular point of interest (especially with respect to my upcoming presentation at All Energy); and
Bucket 3) Finally there’s the “some other form of generation” category which seems to fall into two separate lines of thought, with no clear transition apparent to get from the first to the second:
(a) We have the clapped out second car analogy with respect to existing assets progressively run into the ground; and
(b) We have the [insert your particular hobby-horse zero carbon generation source] potential new development – none of which seems to be likely to get a gig under current policy arrangements. Alinta’s decision to walk away from solar thermal around Port Augusta can be understood as just a result of the current landscape with three factors:
Factor 1 = an oversupply of capacity, with the RET pushing more in, suppressing spot prices (and expectations of unassisted and slightly disorderly exit as the clapped out 2nd cars give up the ghost).
Factor 2 = the RET (large-scale) delivering more wind, being the lowest cost addition source that qualifies – especially given it is just a $/REC measure, with no reference to time or place.
Factor 3 = the SRES delivering more solar, being the lowest cost distributed source.
Back to my analysis of this potential future world, with a particular focus on Demand Response (at least for now)…


Hi Paul, you’ve mentioned what the spillage is in terms of MW, and % of time. I’d also be keen to see what it is in terms of GWh, or even better, % of renewable generation (GWh spilled / GWh of renewable generation).
This is the big question. If you spill 10% of potential production that only increases cost 11%.
Love how you tied solar & wind to the baseload label, well done.
Seems to me that the accuracy in weather forecasting will be the key factor in not just the future electricity market, but also in industry (if they adjust to the peakiness of the market).
I would add another factor for the Alinta decisions: a rather poor (and unjustified) design choice. Specifically 50 MW capacity with 15 hours of storage. That is terrible configuration to asses at this point in time. The same size field / plant (albeit with a large power block and smaller amount of storage) – say 150 MW with 5 hours of storage, would be much more sensible (and would cost a similar amount).
As a side note – the recently constructed solar reserve plant (U.S.) has a 110MW/10hr configuration, which makes more sense in that market, (it was able to secure a PPA for $135/MWh as well).
Perhaps this would still be non-viable – due to the landscape considerations Paul mentioned. But given the price premium for being for being able to sell in the evening peak (or at times of low wind, and/or sell more on demand energy relative to wind) – it would be quite close.