During the past week, we helped Giles post this article noting that wind farm output had reached 2,988MW as a new record (higher than what we saw over summer 2014-15, for instance).
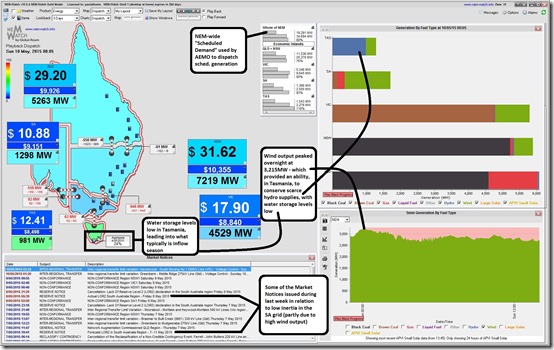
Today I noticed that, in the quiet of the night, wind output had roared along and peaked at 3,215MW in the 00:05 dispatch interval (meaning metered generation output measured at 00:00 leading into Sunday). This point in time is shown in the following snapshot from NEM-Watch v10 (using “Playback” to reset the display to how the market looked back at that time):
See, that this had represented about 16% of the Scheduled Demand Target used by AEMO in dispatching the market:
However note that:
1) this is not a correct measure, strictly speaking, as some of the wind output is non-scheduled, so nets off Scheduled Demand – the real percentage would be somewhat lower than this).
2) also note that demand around midnight is being inflated by off-peak hot water load in South Australia, and that (more generally) demand does not reach its low point across the NEM until around 4am each morning.
The above, however, is indication of how the latest projects added to the grid late in 2014 are contributing to the increased output.
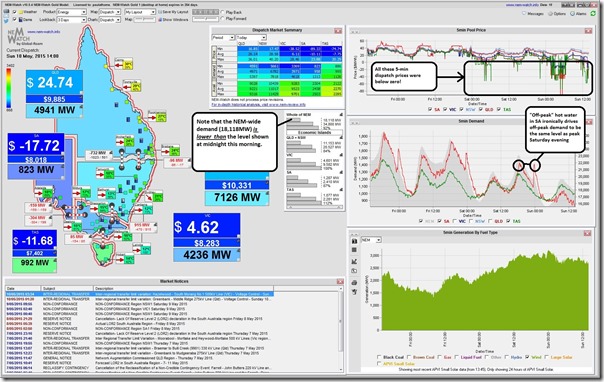
Continuing into this afternoon, we see that the high wind output has continued (though slightly lower) and has been one of the factors delivering very low Scheduled Demand levels across the NEM, and also very low prices – negative in places:
If it’s true that the political argy-bargy over the RET target is closer to resolution (not withstanding the latest political point-scoring shenanigans) then this is the type of thing we might be seeing much more of in the years ahead to 2020.


Great post. The high correlation between wind output in SA and Vic pointed out in a previous post means that prices in both markets are low or negative at times of high wind output and low demand. Increasing the SA-Vic interconnector capacity through the transformer upgrade at Heywood will do little to alleviate this problem. However, correlations in daily wind output between Vic and NSW are much lower. Surely it’s time to re-rate the Vic-NSW interconnector limits. There are 4 high-voltage power lines, but they seem to have very conservative ratings. (The coal generators in NSW would hate this because it would increase the low-cost brown coal power coming from Victoria at times of low demand in the early morning.) The power lines are
1. Khancoban-Tumut 3 (330 kV)
2. Khancoban-Tumut 1 (330 kV)
3. Dedarang-Wagga (330 kV)
4. Red Cliffs-NSW (220 kV)
Khancoban and the Murray power stations are regarded as part of the Victorian system, even though they are physically in NSW..
Looking at the Google Streetview image of power lines just north of the Khancoban switch yard (36°13’0.55″S, 148° 8’29.84″E), there are 4 sets of power lines, 2 of which go from Khancoban to Victoria and can carry 1500 MW of power from the Murray power station into the Victorian market. The westernmost 2 power lines look identical to those going into Victoria, and should be able to take 1500 MW from Khancoban into the New South Wales grid. Yet the maximum Vic-NSW interchange at 4 am this morning was only about 1200 MW, when there was a price of -$10/MWh in Victoria and $23.96 in NSW. The Dedaran-Wagga line should also have a similar capacity of about 750 MW, and the Redcliffs line perhaps another 200 MW. There could be further rating increases with dynamic ratings, because much of the transfer would be required at night at times of high wind and cool temperatures that would keep the wires below their threshold of about 50 degrees C. So there could be a total capacity of well over 2450 MW.
The Qld-NSW interconnector has been progressively up-rated, and looks much less substantial than those at Khancoban, yet I believe carries up to 1000 MW, while the 275 kV SA-Vic interconnector via Heywood looks similar and will soon have a capacity of 680 MW. So the Vic-NSW combined limit of about 1200 MW for 4 major power lines indeed looks on the low side.
A correction to your comment about Tasmania having to conserve hydro supplies . There have been excellent inflows over the last week into the Pieman, Mersey-Forth and Derwent catchments, to the extent that 2 of their hydro dams are spilling. However the catchments with the greatest storage – the Great Lakes (for Poatina) and Gordon have received minimal inflows. So the catchments with good inflows will allow water in the Great Lakes and Gordon to be conserved.
http://www.hydro.com.au/water/lake-levels
There have been periods of negative power prices in Tasmania today – perhaps the combination of high wind, low demand and run-of-river hydro power stations.
What is missing in the market now is pumped storage hydro to level out the market, particularly the 1 am to 5 am periods of negative power prices when there is high wind. According to Wikipedia, the Murray power station has all of its generators capable of pumping, so if true it should have the potential to soak up to 1500 MW from the Victorian system at less than $10/MWh and sell it back to the grid a few hours later at over $30/MWh.
In the NSW system the Tumut 3 power station is pumped storage, and there is also a pumped storage system operated by Sydney Water, so a higher Vic-NSW rating capacity would provide access to these systems.
The NEM report files do show a “Snowy pump” of 200 MW operating during some of this time. Not sure if this is on Tumut3 (NSW system) or Murray (Vic system). Now that intermitancy is becoming a problem, surely one of the best power station investments would now be in these pumped storage systems.
Thanks Martin
The role pump storage hydro might play in balancing increased intermittent supplies is one of the intriguing questions in this all. I wonder what type of consistent price spread there needs to be (between pumping and generation) to make it work, given that (I assume) it would have to be running much more frequently than any of the 3 existing schemes do now.
Paul
Another contributing factor to the negative power prices in Vic at times of low demand and high wind production is that the brown coal generators don’t appear to adjust to the situation with lower output. To them, brown coal is “free” because the operation of the coal mine is a fixed cost, whereas in NSW it is a variable cost (because black coal can be sold on the world market). This market behavior differs from when there was a carbon price was in place and there were variable costs associated with brown coal use.
But their profitability is now so low that another coal-fired power station (150 MW) will soon close.
http://www.theage.com.au/victoria/alcoa-to-shut-anglesea-coalmine-and-power-plant-20150512-ggzgw9.html