Sitting with some traders Wednesday (yesterday) afternoon, there was some interesting discussions about the extent to which the hot weather predicted for Victoria would drive demand higher and hence impact on prices.
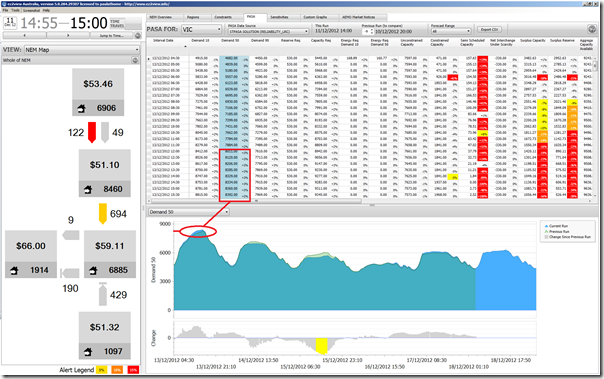
The following image from ez2view, wound back using Time Travel to show a ST PASA demand forecast for Victoria made on Tuesday was illustrative:
As can be seen, the demand forecast was for relatively high demand, but not as high as on 29th November (and certainly not near the all-time maximum from January 2009).
Hence, it was with interest that we watched prices jump up and down (across all four mainland regions) today. The following are some snapshots from NEM-Watch:
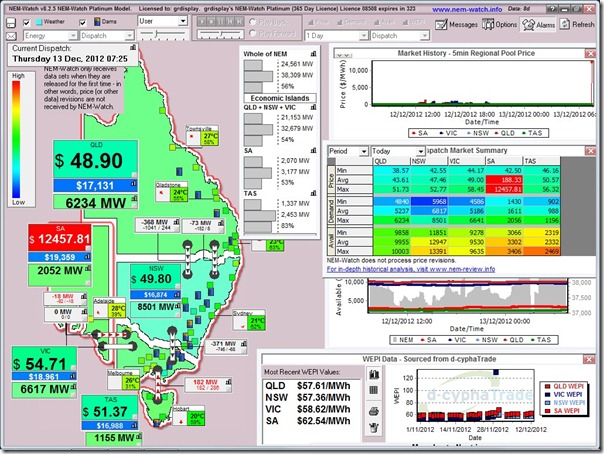
7:25 and prices spike in South Australia
Our phones were buzzing with SMS alerts this morning before we’d even arrived in the office as the price spiked to close to the Market Price Cap as a result of transmission issues:
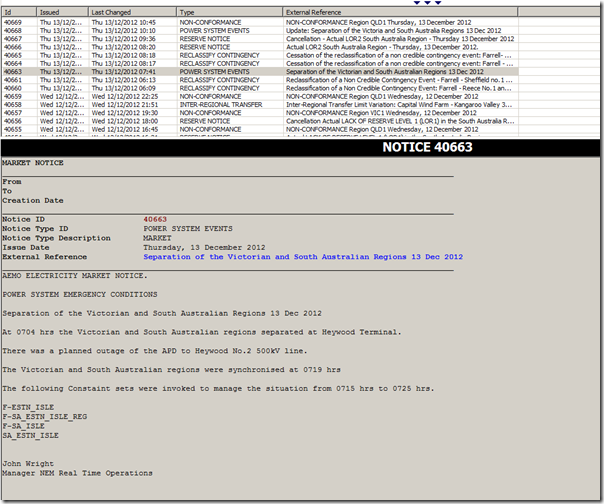
We can see in this display that flow over the Heywood interconnector was out of action, as a result of Power System Emergency Conditions that AEMO explained in this Market Notice:
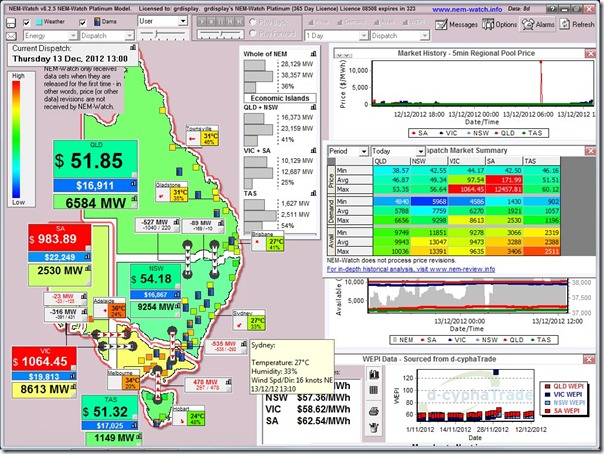
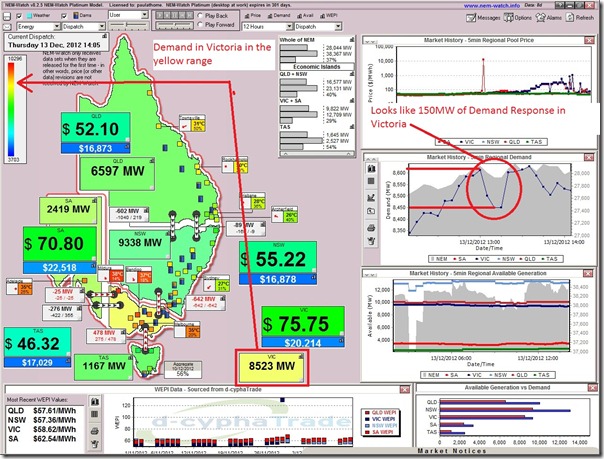
13:00 and we see 150MW of Demand Response in Victoria
At 13:00 NEM time, we see the price spike to above $1000/MWh in Victoria:
As a result of this price spike, we see that demand in Victoria winds back for a few dispatch intervals:
Further information about the benefits of Demand Side Response have been provided previously.
14:25 and prices blip on the mainland
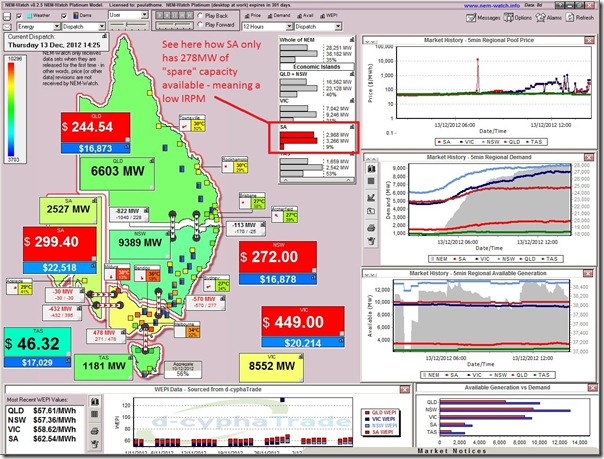
Throughout the afternoon we saw significant price movements in the mainland regions – such as shown in this snapshot from 14:25 where prices in all four mainland regions are in the “red zone”:
In this image, we can see how the “spare” capacity in South Australia available in this Dispatch Interval, at bid at any price, had dropped to just 278MW – meaning that the Instantaneous Reserve Plant Margin for the South Australian “Economic Island” in place for this dispatch interval (because of constrained flow on the interconnectors) dropped below 10%, turning the alert red.
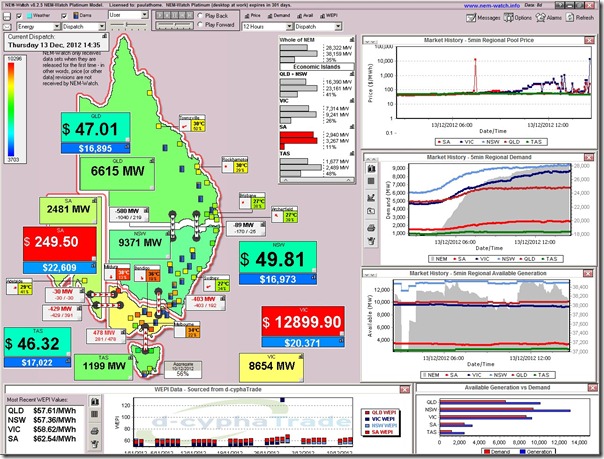
14:35 and prices spike in Victoria
Ten minutes later, we see the Victorian price explode to be $12,899.90/MWh:
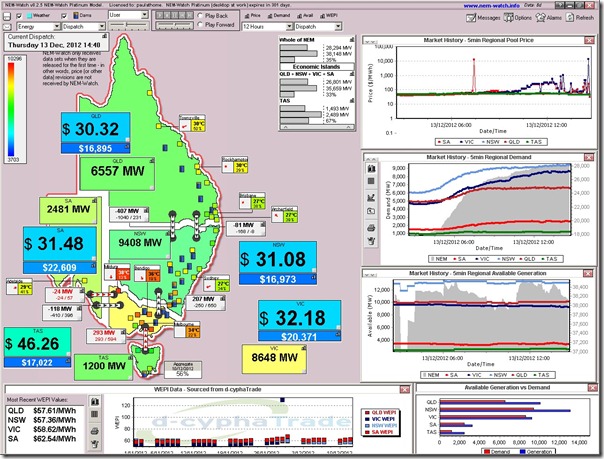
14:40 prices fall away
Five minutes later, we see prices fall away as a result of generation coming into the market, amongst other factors:
14:45 demand peaks in Victoria (for the day)
Demand in Victoria peaked at 14:45 at 8,681MW just 5 minutes later (when measured on a Dispatch Target basis). The colour-coding in NEM-Watch highlights how this was only in the “yellow zone” compared with the all-time maximum set in January 2009.
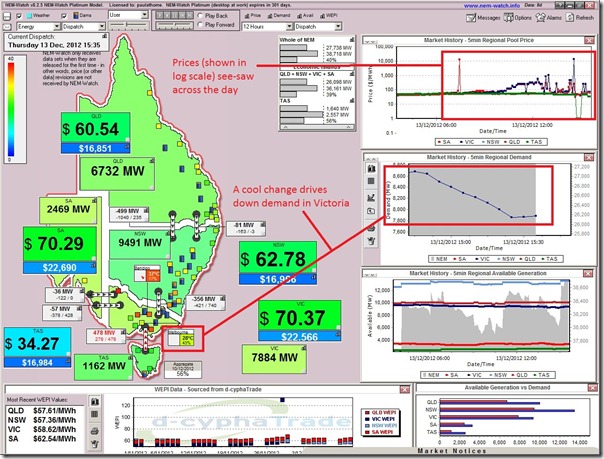
15:35 and demand has dropped away as the cool change arrives
Only one hour later, and we see that demand in Victoria has dropped by about 1,000MW as the cool change arrives:
Looks like an interesting summer ahead…


Be the first to comment on "Prices see-saw across the (mainland) NEM today"