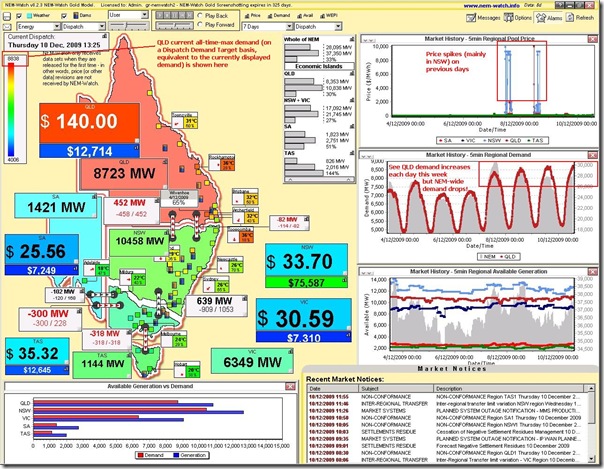
A hot day in Queensland yesterday (Thursday 10th December) dragged demand to within 100MW (or 1%) of the all-time maximum demand for the QLD region.
The dispatch demand target peaked at 8755MW at 15:40 on the day, just 83MW shy of the all-time record of 8838MW.
As shown in the snapshot taken from NEM-Watch at 13:25 (market time) on the day, the demand in QLD was high (relative to the all-time maximum demand, as is implied by the red colour of the region). In contrast, demand in the south and west is very mild, because of the cooler temperatures.
This resulted in the NEM-wide demand level being a very modest 28,095MW.
As a result of the high demand, and constraints on the interconnection through to NSW, the QLD price experienced a modest jump on the day.
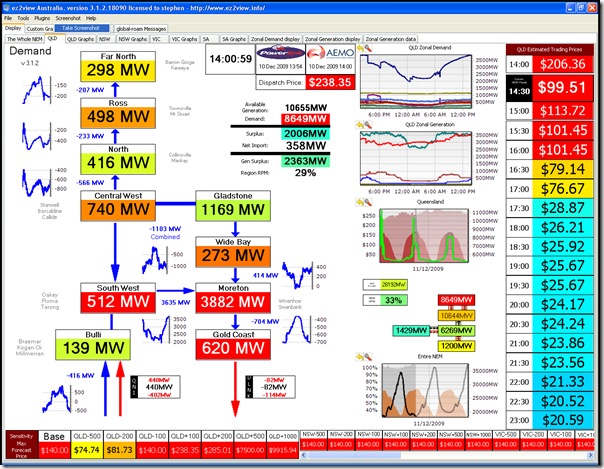
For a more detailed view of what was happening within the QLD region, I have attached a snapshot from the current version of the software we have developed more specifically for market traders, ez2viewAustralia (showing the 14:00 dispatch interval):
This tool incorporates display of a live feed of intra-regional transmission flows and zonal demand levels for nodes in QLD, as supplied by Powerlink Queensland.
This tool also uses colour-coding to highlight relative levels of demand. As can be seen, the high demand on the day was focused more on the south-east corner of QLD (which can be understood by looking at the relatively mild temperatures in north Queensland shown in NEM-Watch above).


Be the first to comment on "High temperatures in QLD yesterday drag demand close to all-time-maximum"