
- Index
- Background
- Introduction
- Summary of Conclusions
- Cost of Congestion
- The “Total Cost of Congestion” figure published by the Australian Energy Regulator (AER); and
- The “Black Hole” figure quoted in some publications by the EUAA.
- The AER’s “Total Cost of Congestion”
- The Total Cost of Congestion (TCC) measure, as defined by the AER, values the cost of producing electricity using the prices at which each generator offers its output to the market.
- The TCC estimates the benefit to the market when all transmission constraints are removed. It does this by modelling the cost of generation that would have resulted without any transmission constraints and comparing it to the actual cost of generation (the difference is the TCC).
- The modelling is based on the generators’ actual (historic) bids.
- In the modelling, the dispatch price for each bid is multiplied by the quantity dispatched at that price, then summed to give a total cost of dispatch. In order words, in the TCC measure, “cost” is defined as input costs, with bid prices being assumed as a proxy for input costs (e.g. fuel and other costs).
- The EUAA’s “Black Hole”
- The Black Hole value is the sum of the Regional volume times price difference between the lowest priced Region and the relevant Regions;
- Regional demand is discounted by 10% as an arbitrary adjustment for transport losses;
- The estimates are really ‘back-of-the-envelope’ and use Weekly Average demand and price data to facilitate rapid, regular, computation.
- The methodology for the calculation of the “Black Hole” figure quoted in the EUAA’s publications was developed by Marsden Jacobs Associates (MJA).
- MJA was happy to explain this methodology, when asked, and provided a copy of the document “Comment on MCE Proposal for a ‘Regulatory Test’ Rule Change” (19 June 2006) to further the explanation. We have been unable to find an internet reference at which you could access this report, but will include one here later, if it can be found.
- Based on the explanation provided, it was seen that the MJA “Black Hole” methodology was similar to that used in preparing our figures for the conference in March (Analysis of price volatility in the QLD region over summer 2007-08), with two of the main differences being:
- That the “Black Hole” methodology uses average weekly values, and compares the QLD price with the lowest priced NEM region; whilst
- Our analysis used dispatch (5-minute) price data, and compared the QLD price with the NSW price.
- The Method We Used
- the AER’s measure of “Total Cost of Congestion”, being an input cost model, represents an approximation of the total cost to the market as a whole, whereas
- the EUAA’s “Black Hole” measure, and the numbers quoted in our presentation in March, are both different approximations of the total cost of congestion to energy users (however both are measures that overstate this cost).
For the EUAA’s Members Meeting (held in Brisbane on 24th April 2008), our Managing Director was invited to provide of a précis of the presentation he previously provided at the “QLD Energy” conference (on 12th March 2008).
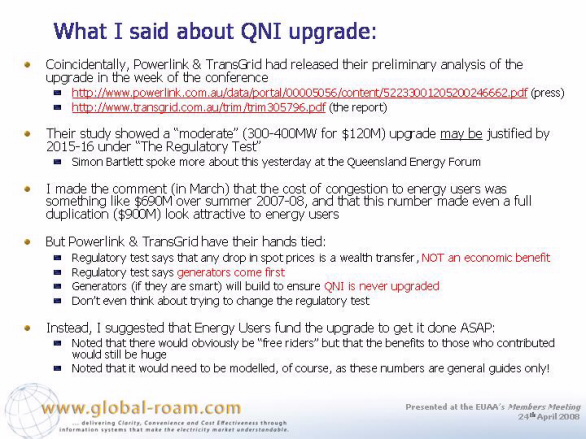
In particular, comments made by Paul with respect to the proposed upgrade to QNI – which was topical at the time of the conference, given that Powerlink and TransGrid had released their analysis of several upgrade options in the same week as the conference.
As a result of the presentation, Duncan Hughes wrote an article about the potential cost to energy users of the upgrade, and published this in the Australian Financial Review on 13th March 2008.
Given the magnitude of the numbers reported, this issue has proved to be of significant issue to large energy users – hence the invitation to present at the Member’s Meeting.
The initial presentation made at the QLD Energy conference has previously been summarised in another article on the WattClarityTM blog: Analysis of price volatility in the QLD region over summer 2007-08. Hence it will not be copied here.
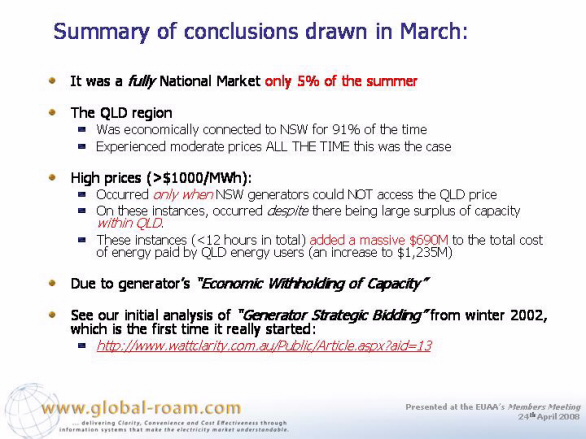
It is worth re-iterating the conclusions drawn at the conference in March, expanded on slightly at the Members Meeting, as shown here:
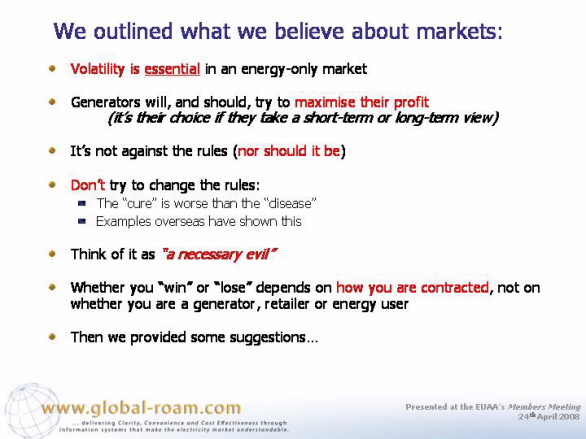
We reiterated our belief that the market is not fundamentally broken:
And we focused on the suggestions made with respect to the QNI upgrade, given that this was
what was of most immediate interest to energy users:
We did not have time to highlight
the comments also provided with respect to the synergies the privatisation of generation capacity in NSW would have for energy users, and others.
Following from the original presentation, and press report, a deal of discussion was held between various parties with respect to the figures quoted as the cost of congestion.
In particular, it was noted that these figures did not reconcile with two other quoted figures for the cost of congestion:
As a result, we did some further investigation of the methodology used by the AER in deriving its “Total Cost of Congestion” measure.
Reports provided by the AER that we reviewed included the following ones:
“Market impact of congestion”
and
The Decision report from June 2006 – “Indicators of the Market Impact of Congestion”
From our review it was identified that (our emphasis added below):
Hence, it was identified that the AER’s measure of Total Cost of Congestion is a measure of costs to the whole market – with “market” being defined as the electricity market bounded by generators on the supplier side, and energy users on the demand side.
As such, this definition is aligned with the definition of “Market Benefits” used in the Regulatory Test.
However – whilst this is a plausible measure of the cost of congestion to the whole market, it should be clearly understood that the measure will tend to significantly underestimate the cost of congestion to energy users.
We also investigated the methodology used to calculate the “black hole” figures sometimes quoted in EUAA publications.
Based on our investigations, we believe that:
Hence, this analysis would tend to over-state the true cost of congestion to energy users – in simple terms, if congestion was alleviated, the marginal price in the lower priced (i.e. exporting) region would usually rise (probably by a relatively small amount) whilst the price in the higher priced (i.e. importing) region would usually drop (sometimes by a considerable margin). Hence the simple price difference would be an over-statement of the cost.
SUPPLEMENTARY COMMENT ADDED 13th AUGUST 2008
Following from our presentation at the EUAA’s Members Meeting (on 24th April) and publication of this article, it was pointed out that this article could be clarified as follows:
It was pointed out by MJA that the primary benefit of the “Black Hole” methodology is that it is easy to calculate using Average Weekly values from the NEM Market Summary Reports.
It was also pointed out that we should have also make reference to MJA’s “Auction Theory” estimate, which while still ‘back of the envelope’ makes assumptions that go some way towards addressing the over-estimate in the “Black Hole”. It was pointed out by MJA that the “Auction Theory” methodology is consistent with the methodology used (in overseas jurisdictions) to establish a “market value benchmark” for telecommunications frequency bands. MJA noted that the same basic methodology has been used to take money from investors, making it “more real” than the notional approach used by the AER in its TCC estimates.
Taking into account this other methodology, it would appear to us (without looking in detail at the numbers) that all three methodologies (MJA’s “Black Hole”, MJA’s “Auction Theory” and our analysis from March 2008) would tend to overestimate the true cost of congestion to energy users – not the least of which because all 3 methods do not take into account the fact that prices would have risen in the lower-priced regions if transmission constraints had not been present.
Hence, all 3 methods would overstate the true cost, just as the AER’s methodology for calculating the “cost of congestion” calculates the cost to the market, and hence underestimates the true cost to energy users.
In our analysis conducted for the presentation at QLD Energy, we used a similar approach to that used in the “Black Hole” methodology (in that we looked at price differences) – except we utilised all dispatch data over time range, instead of averages, and that we just looked at QLD and NSW prices.
Hence our approach, whilst being more accurate as a result of using a more granular data set, would have suffered a similar fundamental shortcoming – and, as a result, would have the effect of over-stating the cost of congestion to energy users.
The need for more detailed modelling was noted during the initial presentation at QLD Energy, and was restated at the EUAA Members Meeting.
These findings we summarised in the following slide:
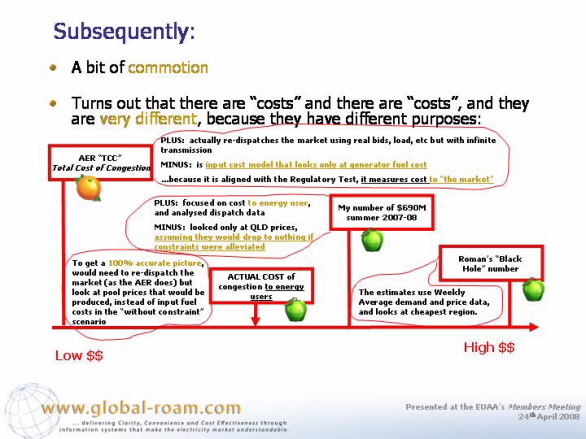
The key point in this slide is that
As noted in the above slide, if one wanted to calculate a true cost of congestion to energy users, they would need to employ a combination of the two approaches – which would result in a figure somewhere between the two extremes.
Be the first to comment on "Cost of congestion to energy users"