

Trading utility-scale batteries is at once exhilarating and terrifying. On volatile days, millions of dollars can be made on trading decisions that must be made rapidly and revisited constantly in a market like the NEM, where prices can move by thousands of dollars per MWh from one interval to the next.
Intelligent automated bidding systems have been transformative in managing this complex 24/7 task, enabling a wider cohort of companies to enter and actively participate in the electricity market. However, as the number of live batteries in the market has grown, large differences in observable trading behaviour and performance outcomes have also become apparent.
This article is an expanded write-up of my talk at the 2026 All Energy conference and explores:
- The role that risk tolerance plays in trading strategy;
- How contracted revenue positions and portfolio composition can change what “optimal” trading looks like; and
- How to make performance comparisons meaningful.
The role of risk
Dispelling the human vs algorithm fallacy
Most rhetoric that pits human traders vs algorithms reminds me of the American folk tale John Henry vs the Steam Engine (spoilers: John Henry won a railroad building contest against a machine but died immediately after from overexertion).
I am sure most spot traders would agree that competing in a protracted interval-by-interval trading contest against an optimisation algorithm would be a misdirected exercise.
In the NEM, even a great human trader will generally struggle to match a great algorithm at consistently making accurate predictions of price outcomes and executing bidding decisions over any meaningfully long period. At the same time, human judgement is essential to exercise an appropriate level of risk management when making trading decisions in many circumstances, such as during more volatile market conditions. Without adequate oversight, algorithms can easily make bad decisions like charging at very high prices (Figure 1).
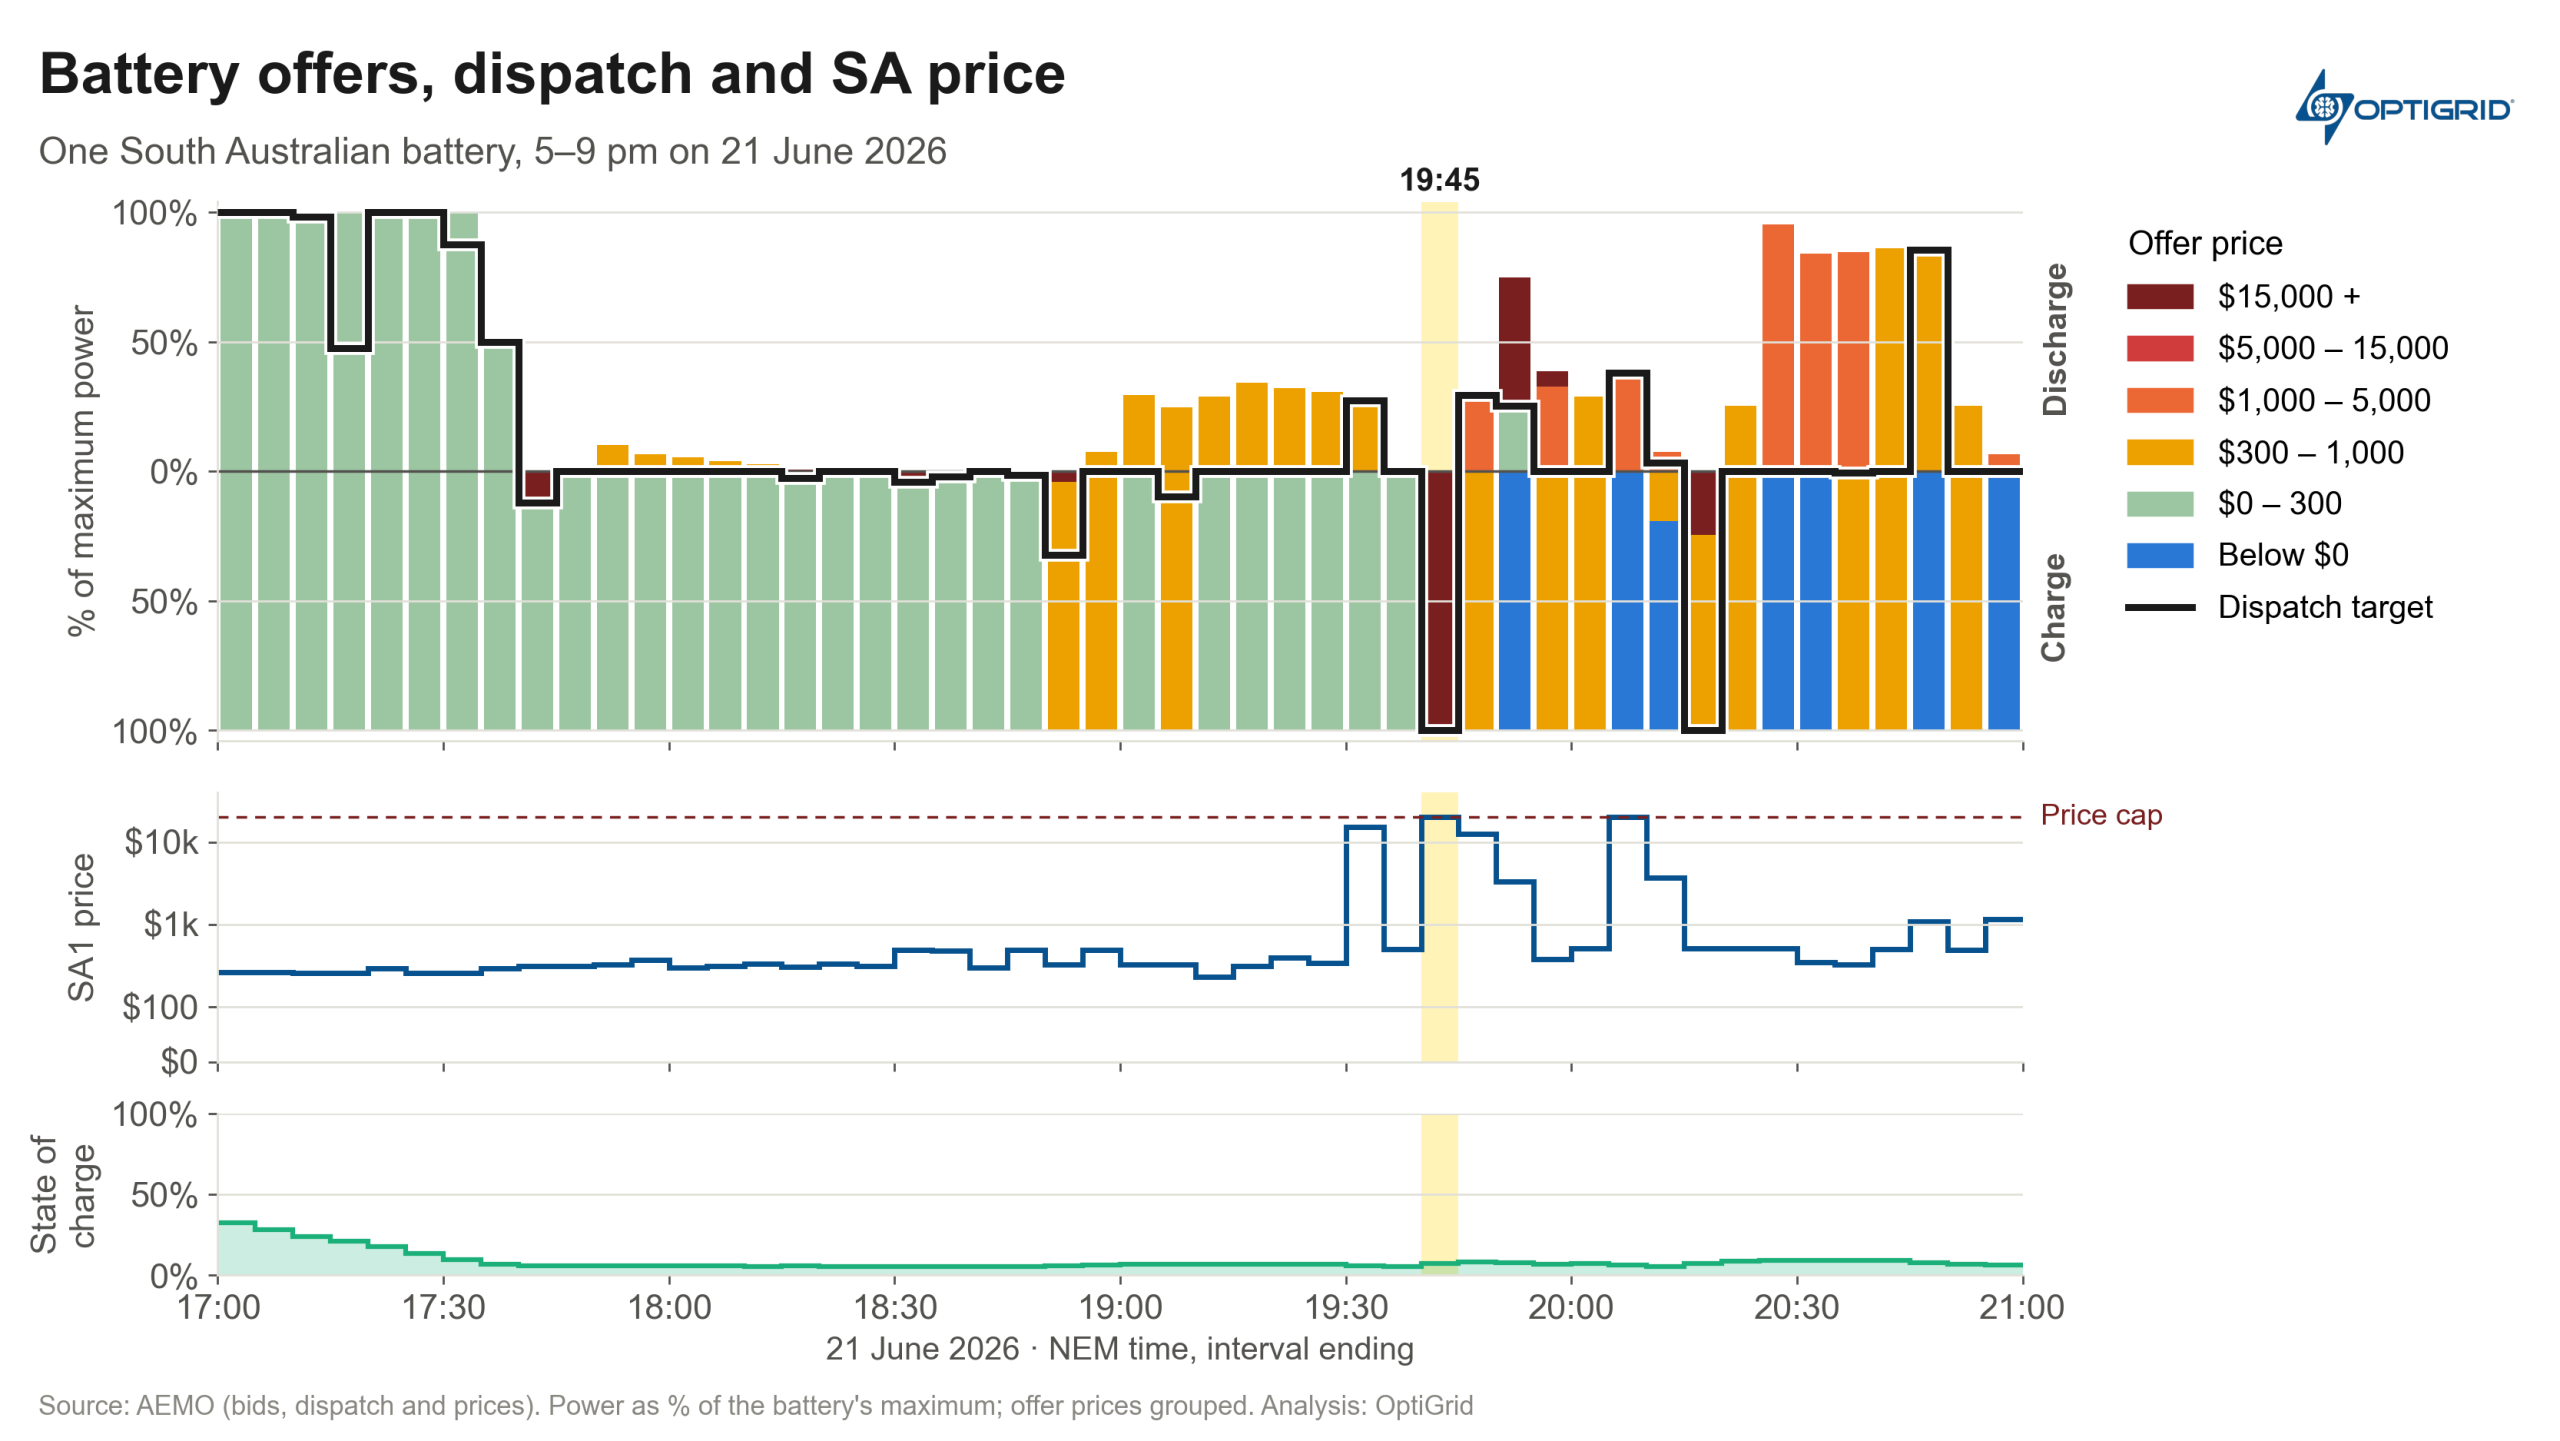
Figure 1. A battery charges at the market price cap at 7:45 pm on 21 June 2026
While specific decisions can be sensitive to the robustness of the optimisation model, the more useful question is often what led the algorithm there in the first place. Even the best algorithm can only act within the objectives and constraints it has been given. If those parameters don’t reflect the battery operator’s risk appetite, contract position or wider portfolio-driven objectives, human traders will almost certainly need to intervene frequently.
Example 1: Outcome of three bidding strategies (12 October 2026)
To illustrate the impact of risk appetite on performance outcomes, let’s look at the results of three overly simplified but distinct bidding strategies of a hypothetical 100 MW / 200 MWh battery in NSW on 12 October 2026.
For ease of comparison, the only difference between these three strategies is the price band it will offer its full capacity at on each day:
- The Early Seller: $300 / MWh
- The Patient Seller: $1,000 / MWh
- The Spike Seller: $10,000 / MWh
On the afternoon of 12 October 2026, a variety of factors came together that caused the NSW electricity price to hit $23,107/MWh at 2:20 pm and 2:30 pm, and then spend most of the next hour near $10,000/MWh. The market dynamics at play merit their own article but in summary:
- Coal was short: Black coal availability averaged about 4,920 MW, well below its three-month average of about 6,270 MW, with a Bayswater unit offline.
- Rooftop solar supply fell: Cloud left rooftop solar about 1,800 MW below the day before, and as it fell away through the afternoon, demand rose about 2,600 MW in two hours, from 1:30 pm to 3:30 pm.
- Coal and gas took time to ramp back up: Bayswater added about 870 MW, but over three hours. And imports from outside the state were blocked.
- Constraints were triggered: An outage of the Canberra–Capital line brought in a stability constraint (N::N_CNCW_2) curtailed 750–1,200 MW of southern NSW wind, held back Tumut hydro and southern NSW batteries, and pushed NSW to export up to 1,429 MW to Victoria, where prices were negative. Imports from Queensland were capped at 500 MW until 4:05 pm.
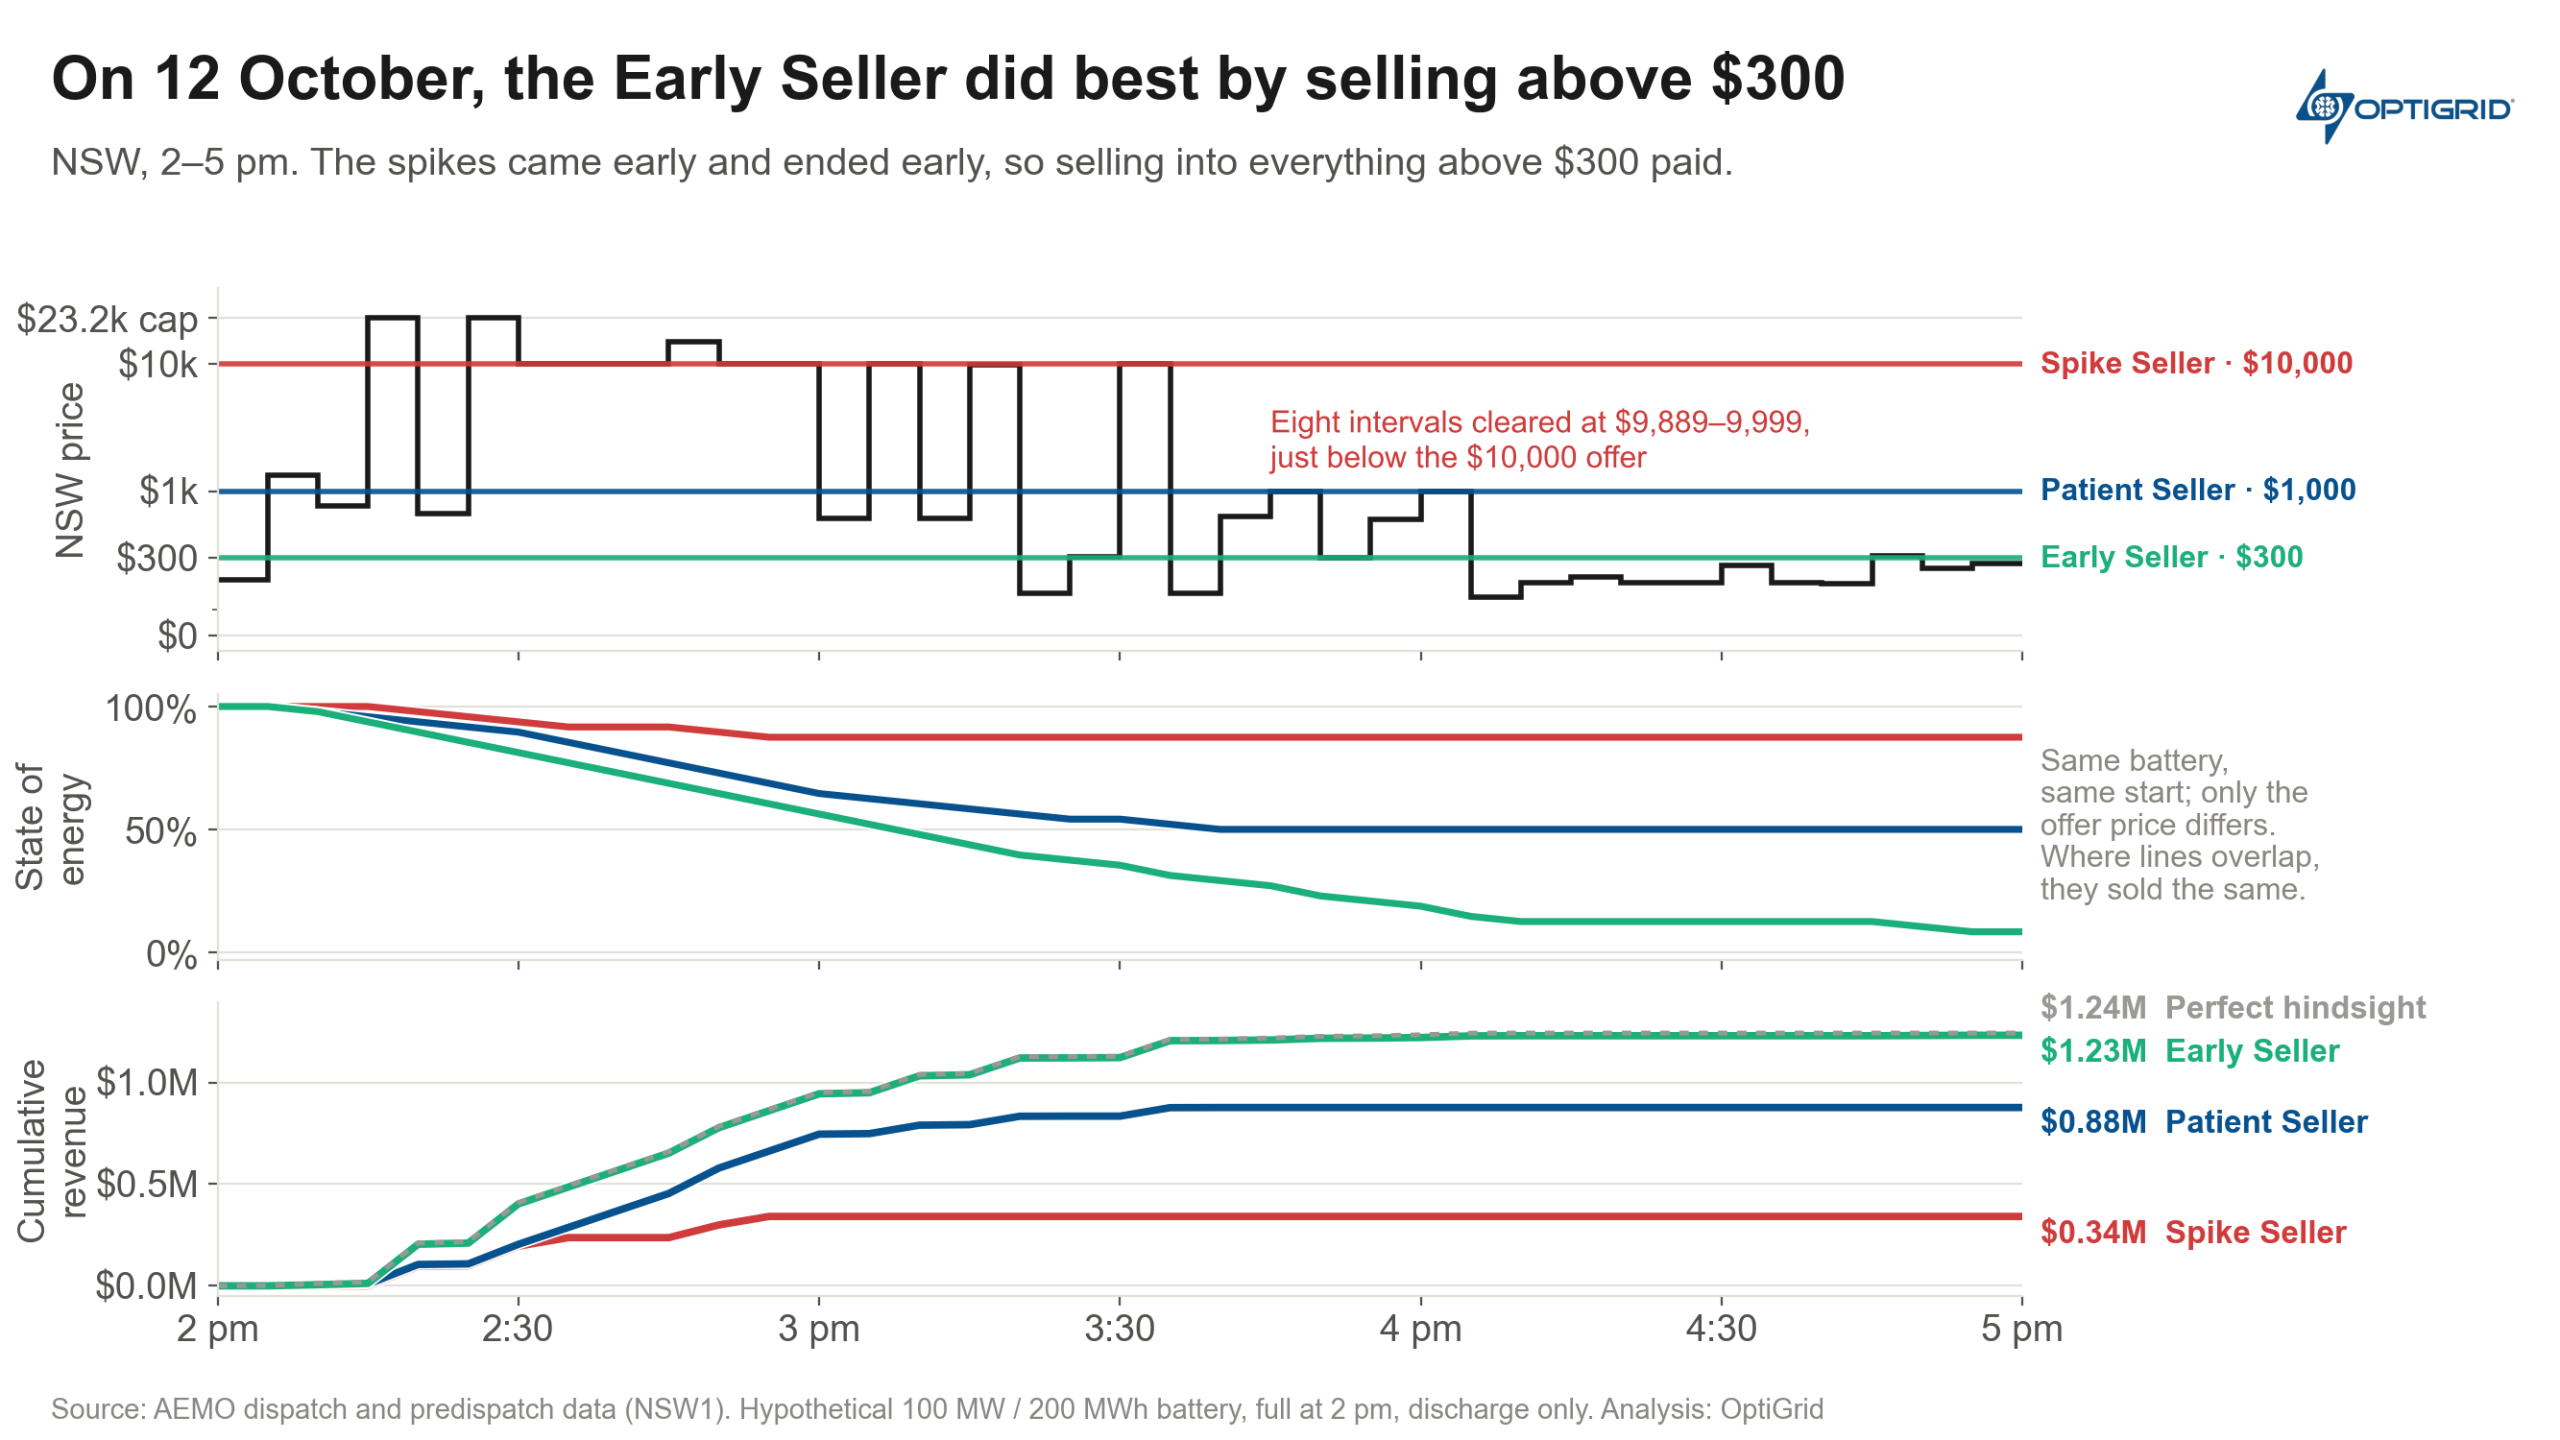
AEMO’s predispatch had been forecasting prices at the cap for the afternoon as early as the night before, and at 2:30 pm it still expected them to persist until 7 pm (see Figures 2 and 3). At this point in time, which of the three bidding strategies would you choose? Figure 4 shows how each strategy would have played out.
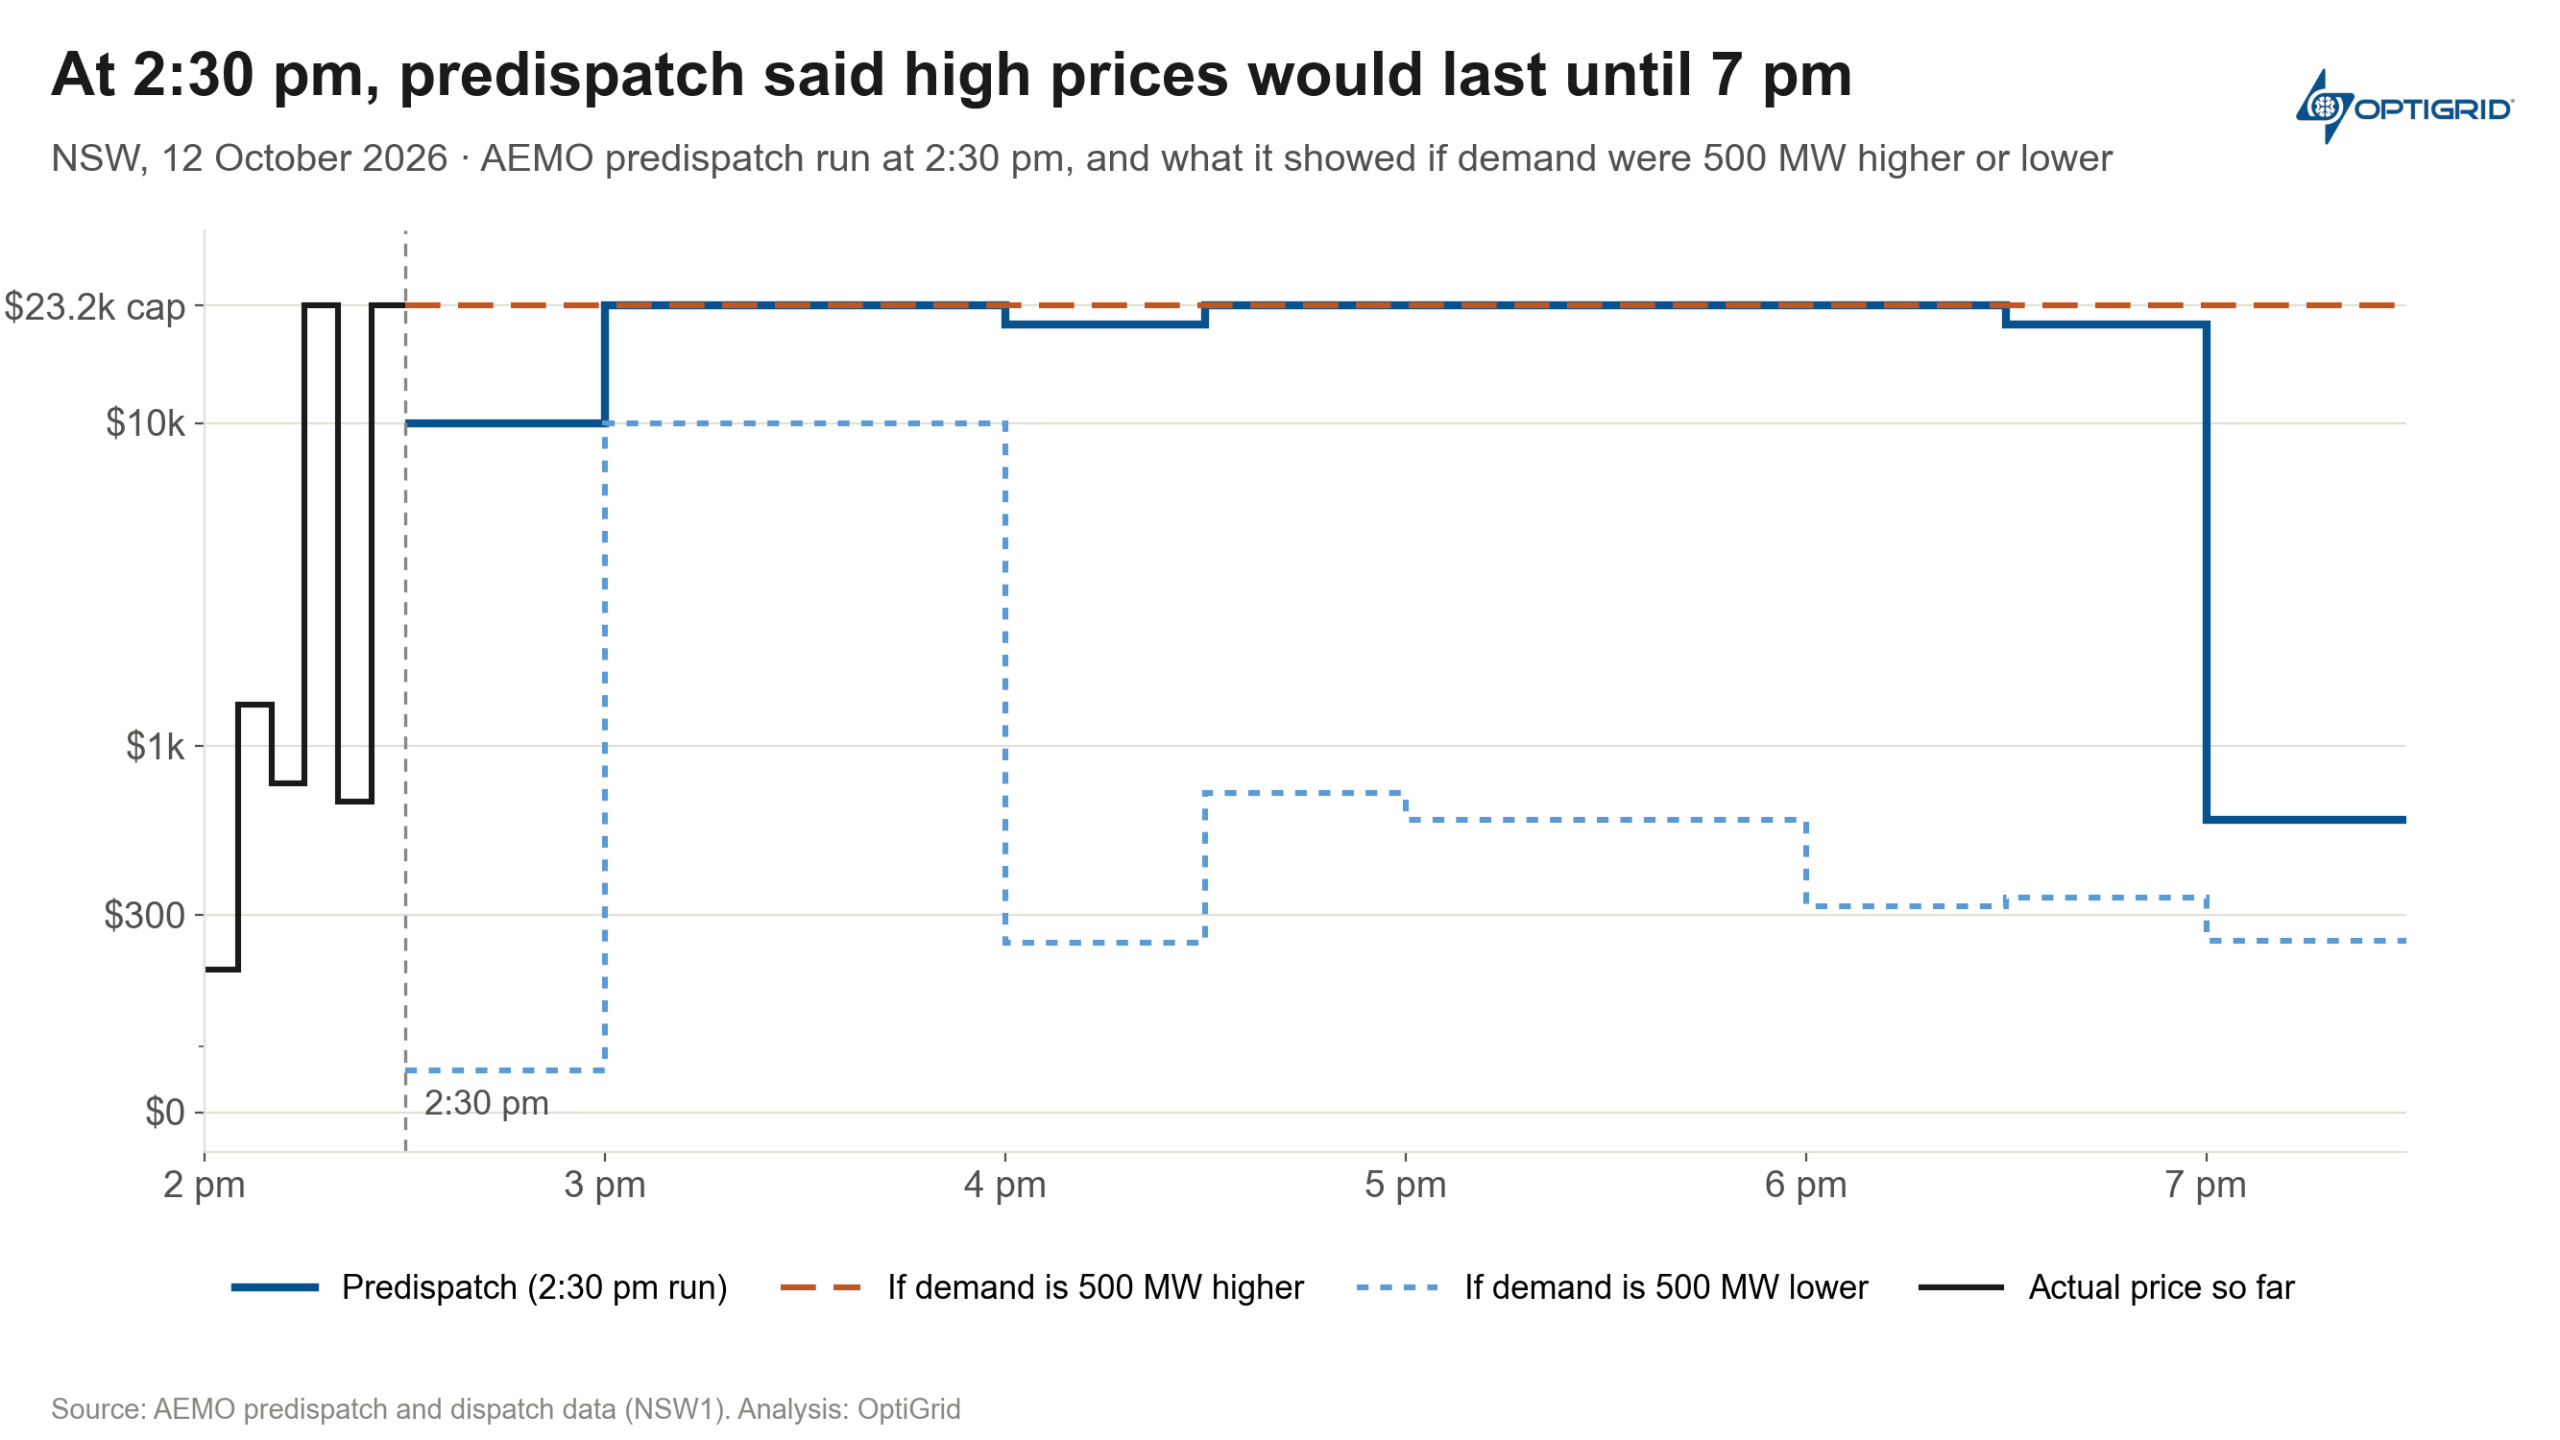
Figure 2. At 2:30 pm AEMO predispatch said high prices would last until 7 pm
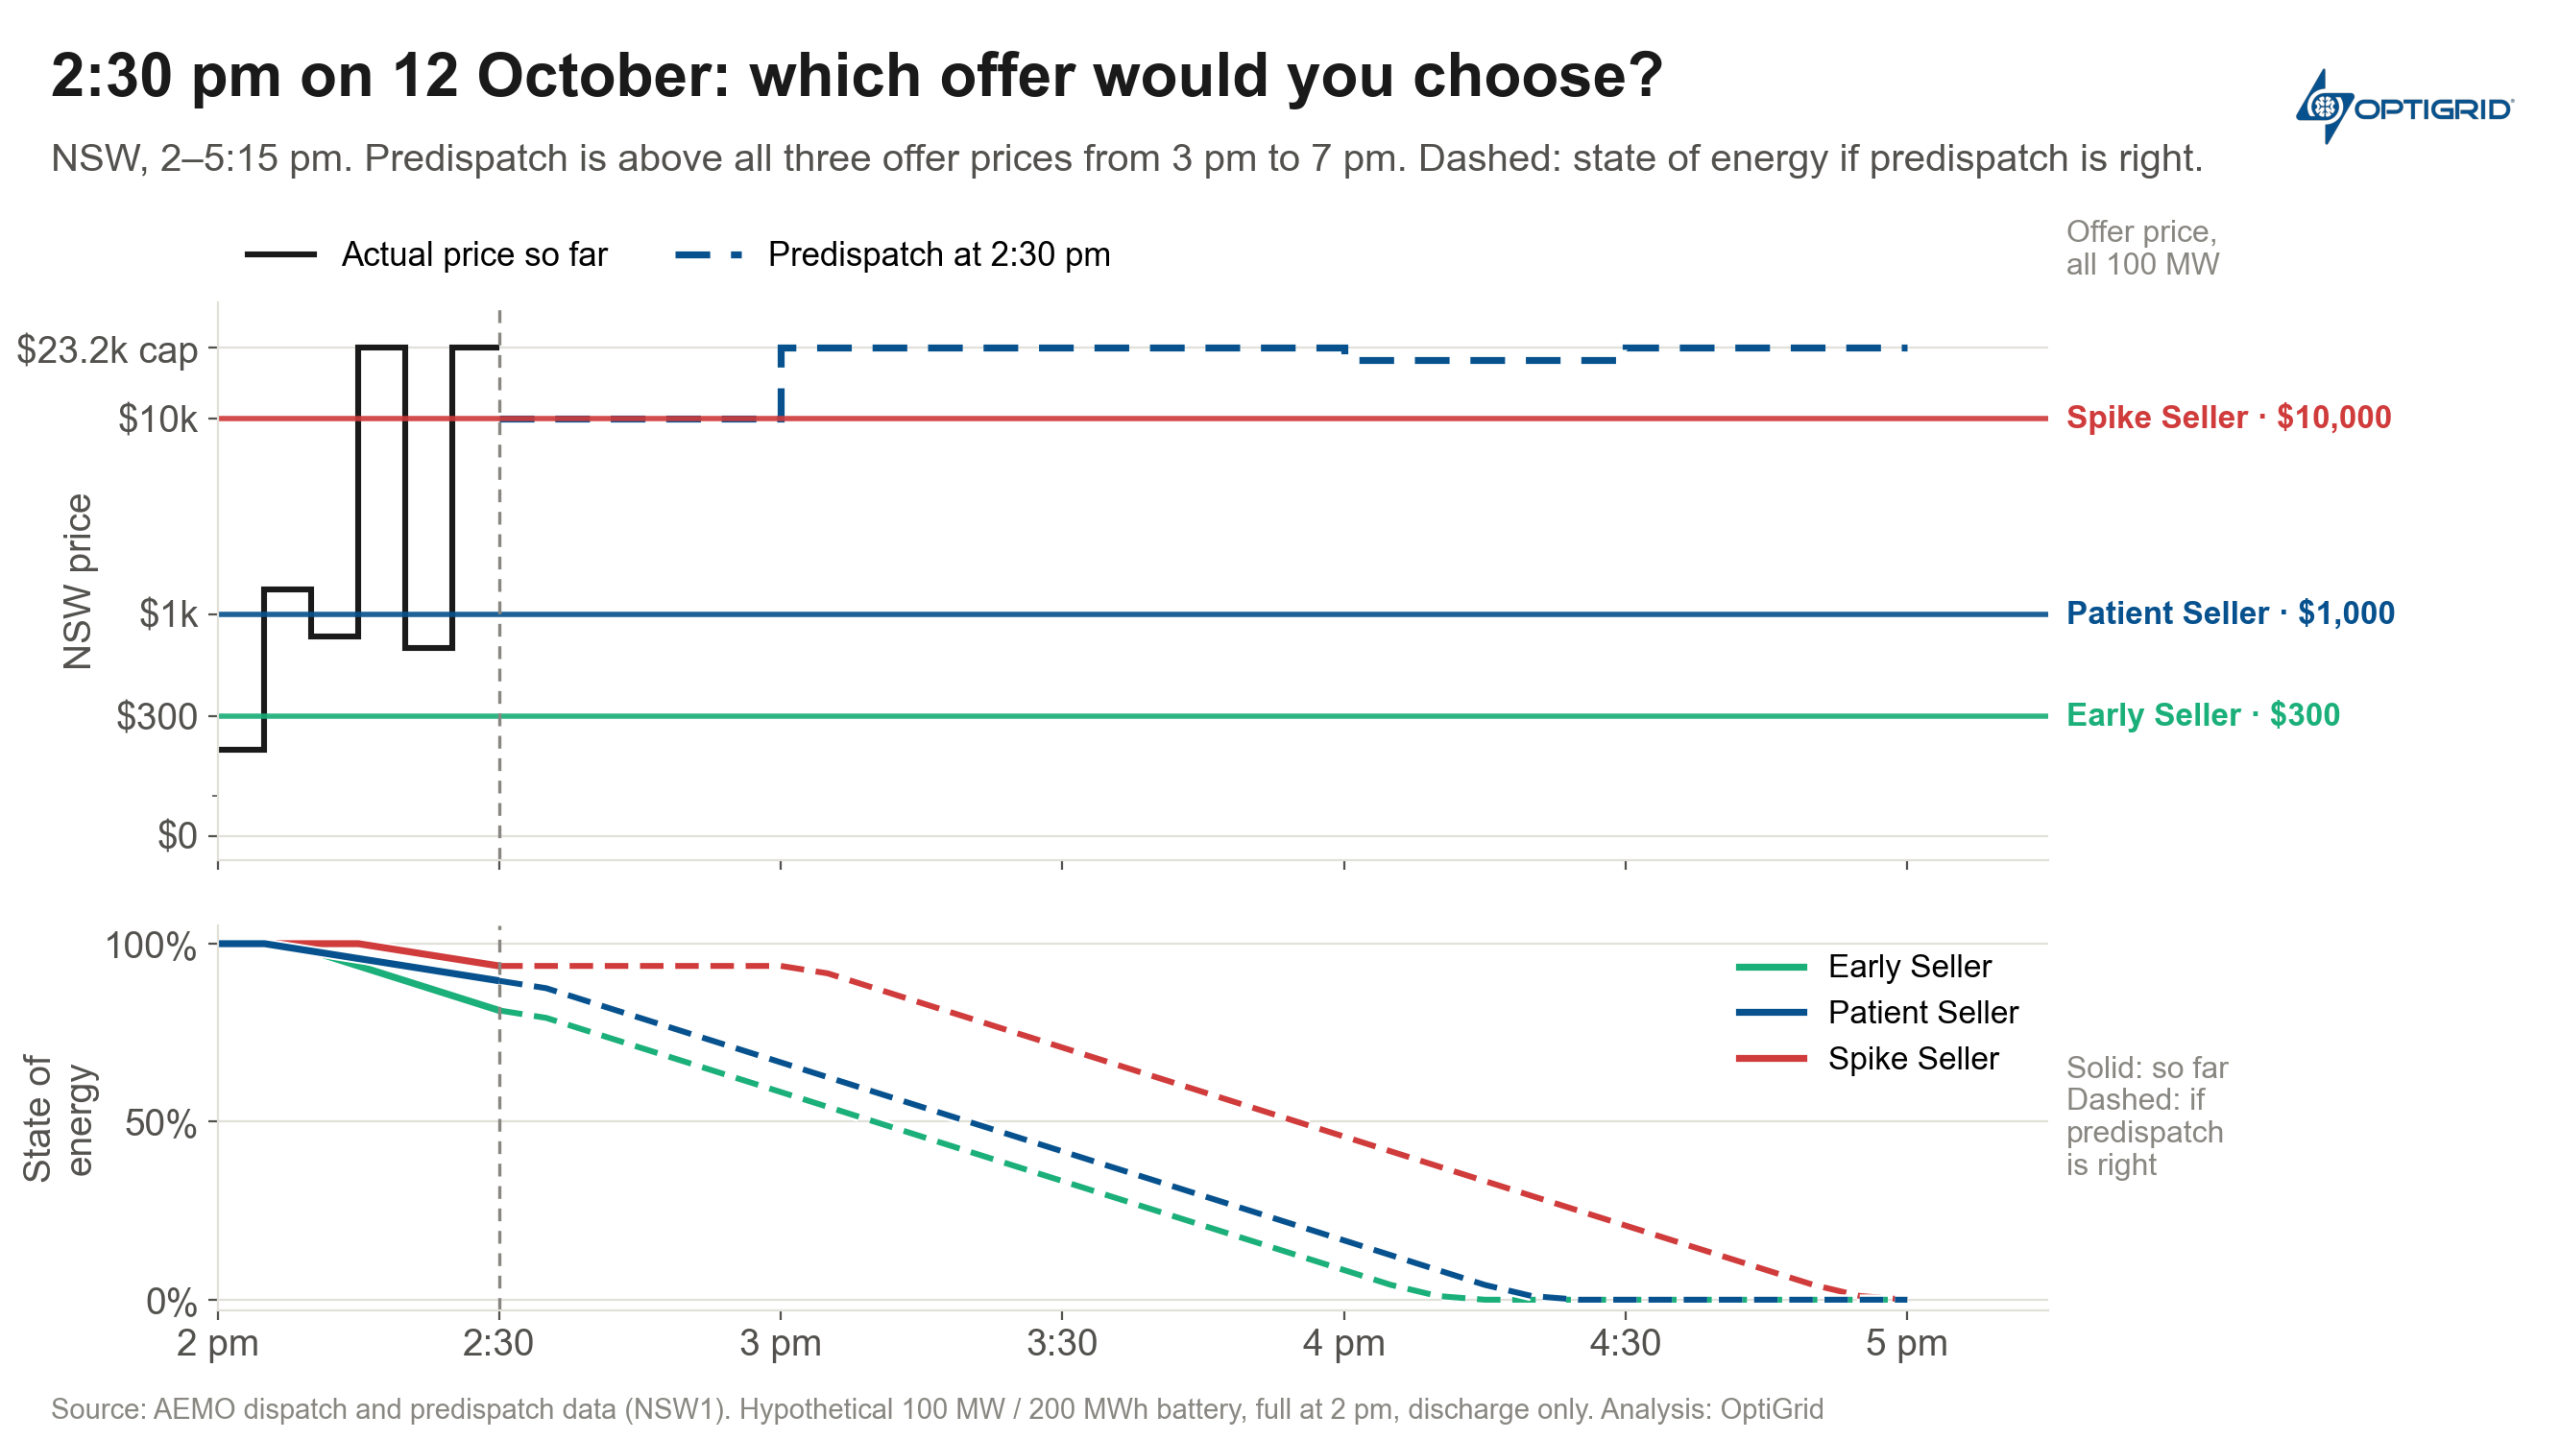
Figure 3. Deciding how to bid for the rest of the afternoon on 12 Oct 2026
Assumptions: 100 MW / 200 MWh battery, full (200 MWh) at 2 pm, discharge only at 100% efficiency, energy revenue only (no FCAS), and a price-taker whose offers do not move the price. As in AEMO dispatch, output ramps in a straight line from one 5-minute target to the next, so the battery cannot jump straight to full output, and it is paid for the energy it delivers while ramping up and down. It always keeps enough energy to ramp back to zero.
| Figure 4. Performance of each strategy by the end of the day
A. Early Seller: $1.23 million, within 1% of the $1.24 million a battery with perfect hindsight could have made. The spikes came early and the evening peak that predispatch showed never came, so selling into every interval >$300/MWh paid off. B. Patient Seller: sold into all eleven intervals above $5,000/MWh but sat out most of the $300–1,000/MWh intervals in between. It made $0.88 million and was still 50% charged at 4 pm, with the spike almost over. C. Spike Seller: only $0.34 million, just over a quarter of the Early Seller’s result: eight of the spike intervals cleared at $9,889–9,999/MWh, just below its $10,000/MWh offer (seven of them at $9,998.66/MWh), so it was dispatched in only the three intervals at $15,000/MWh or more. |
Example 2: Same three strategies on a very different day (10 January 2026)
So what happens if we take the same three strategies and apply them on 10 January 2026, another day where high prices materialised?
Predispatch had flagged an evening spike all day: from early morning it showed prices above $5,000/MWh from about 5 pm, peaking at roughly $15,000–20,300/MWh around 7 pm. At 4:30 pm it still showed $12,000/MWh or more from 5:30 pm, with the $20,300/MWh cap for 6:30–7 pm (Figure 5).
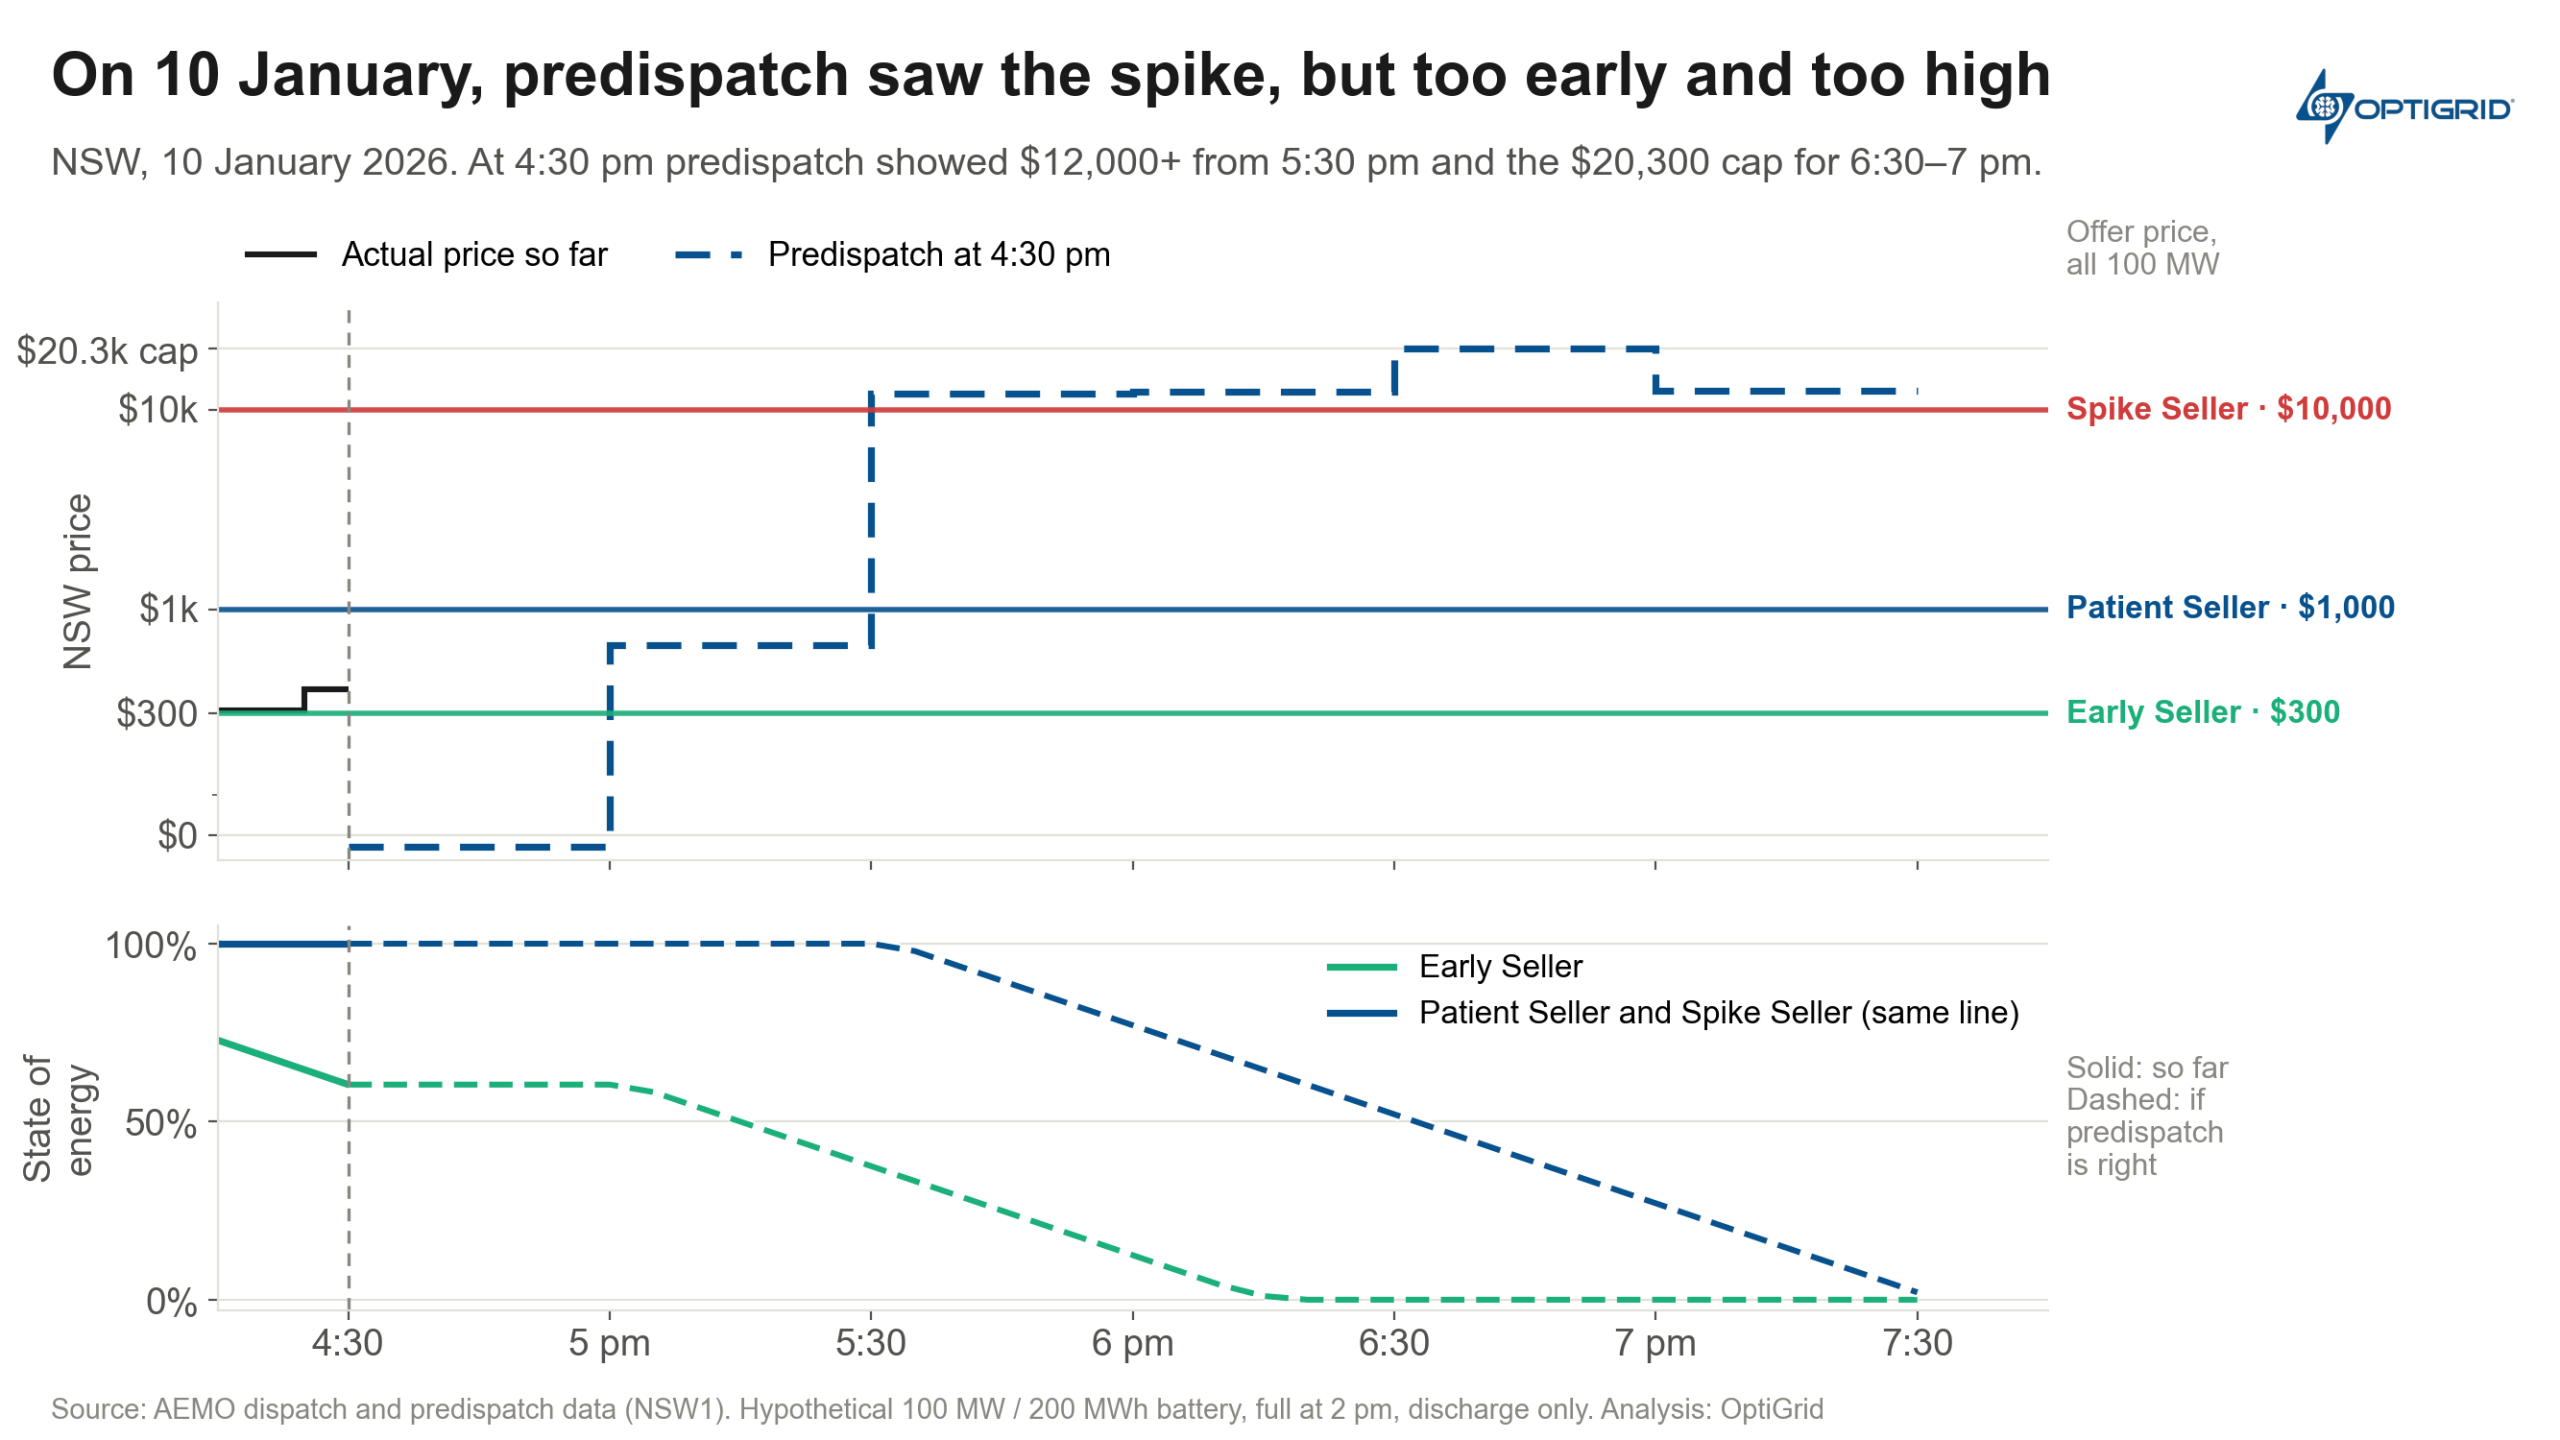
Figure 5. On 10 Jan 2026, predispatch showed a price spike, but too early and too high
The spike arrived later in the evening, causing the Patient Seller and Spike Seller strategies to return 8–9 times the revenue of the Early Seller strategy (Figure 6). The same strategy that came within 1% of perfect hindsight on 12 October made a fraction of the revenue of the other two on 10 January.
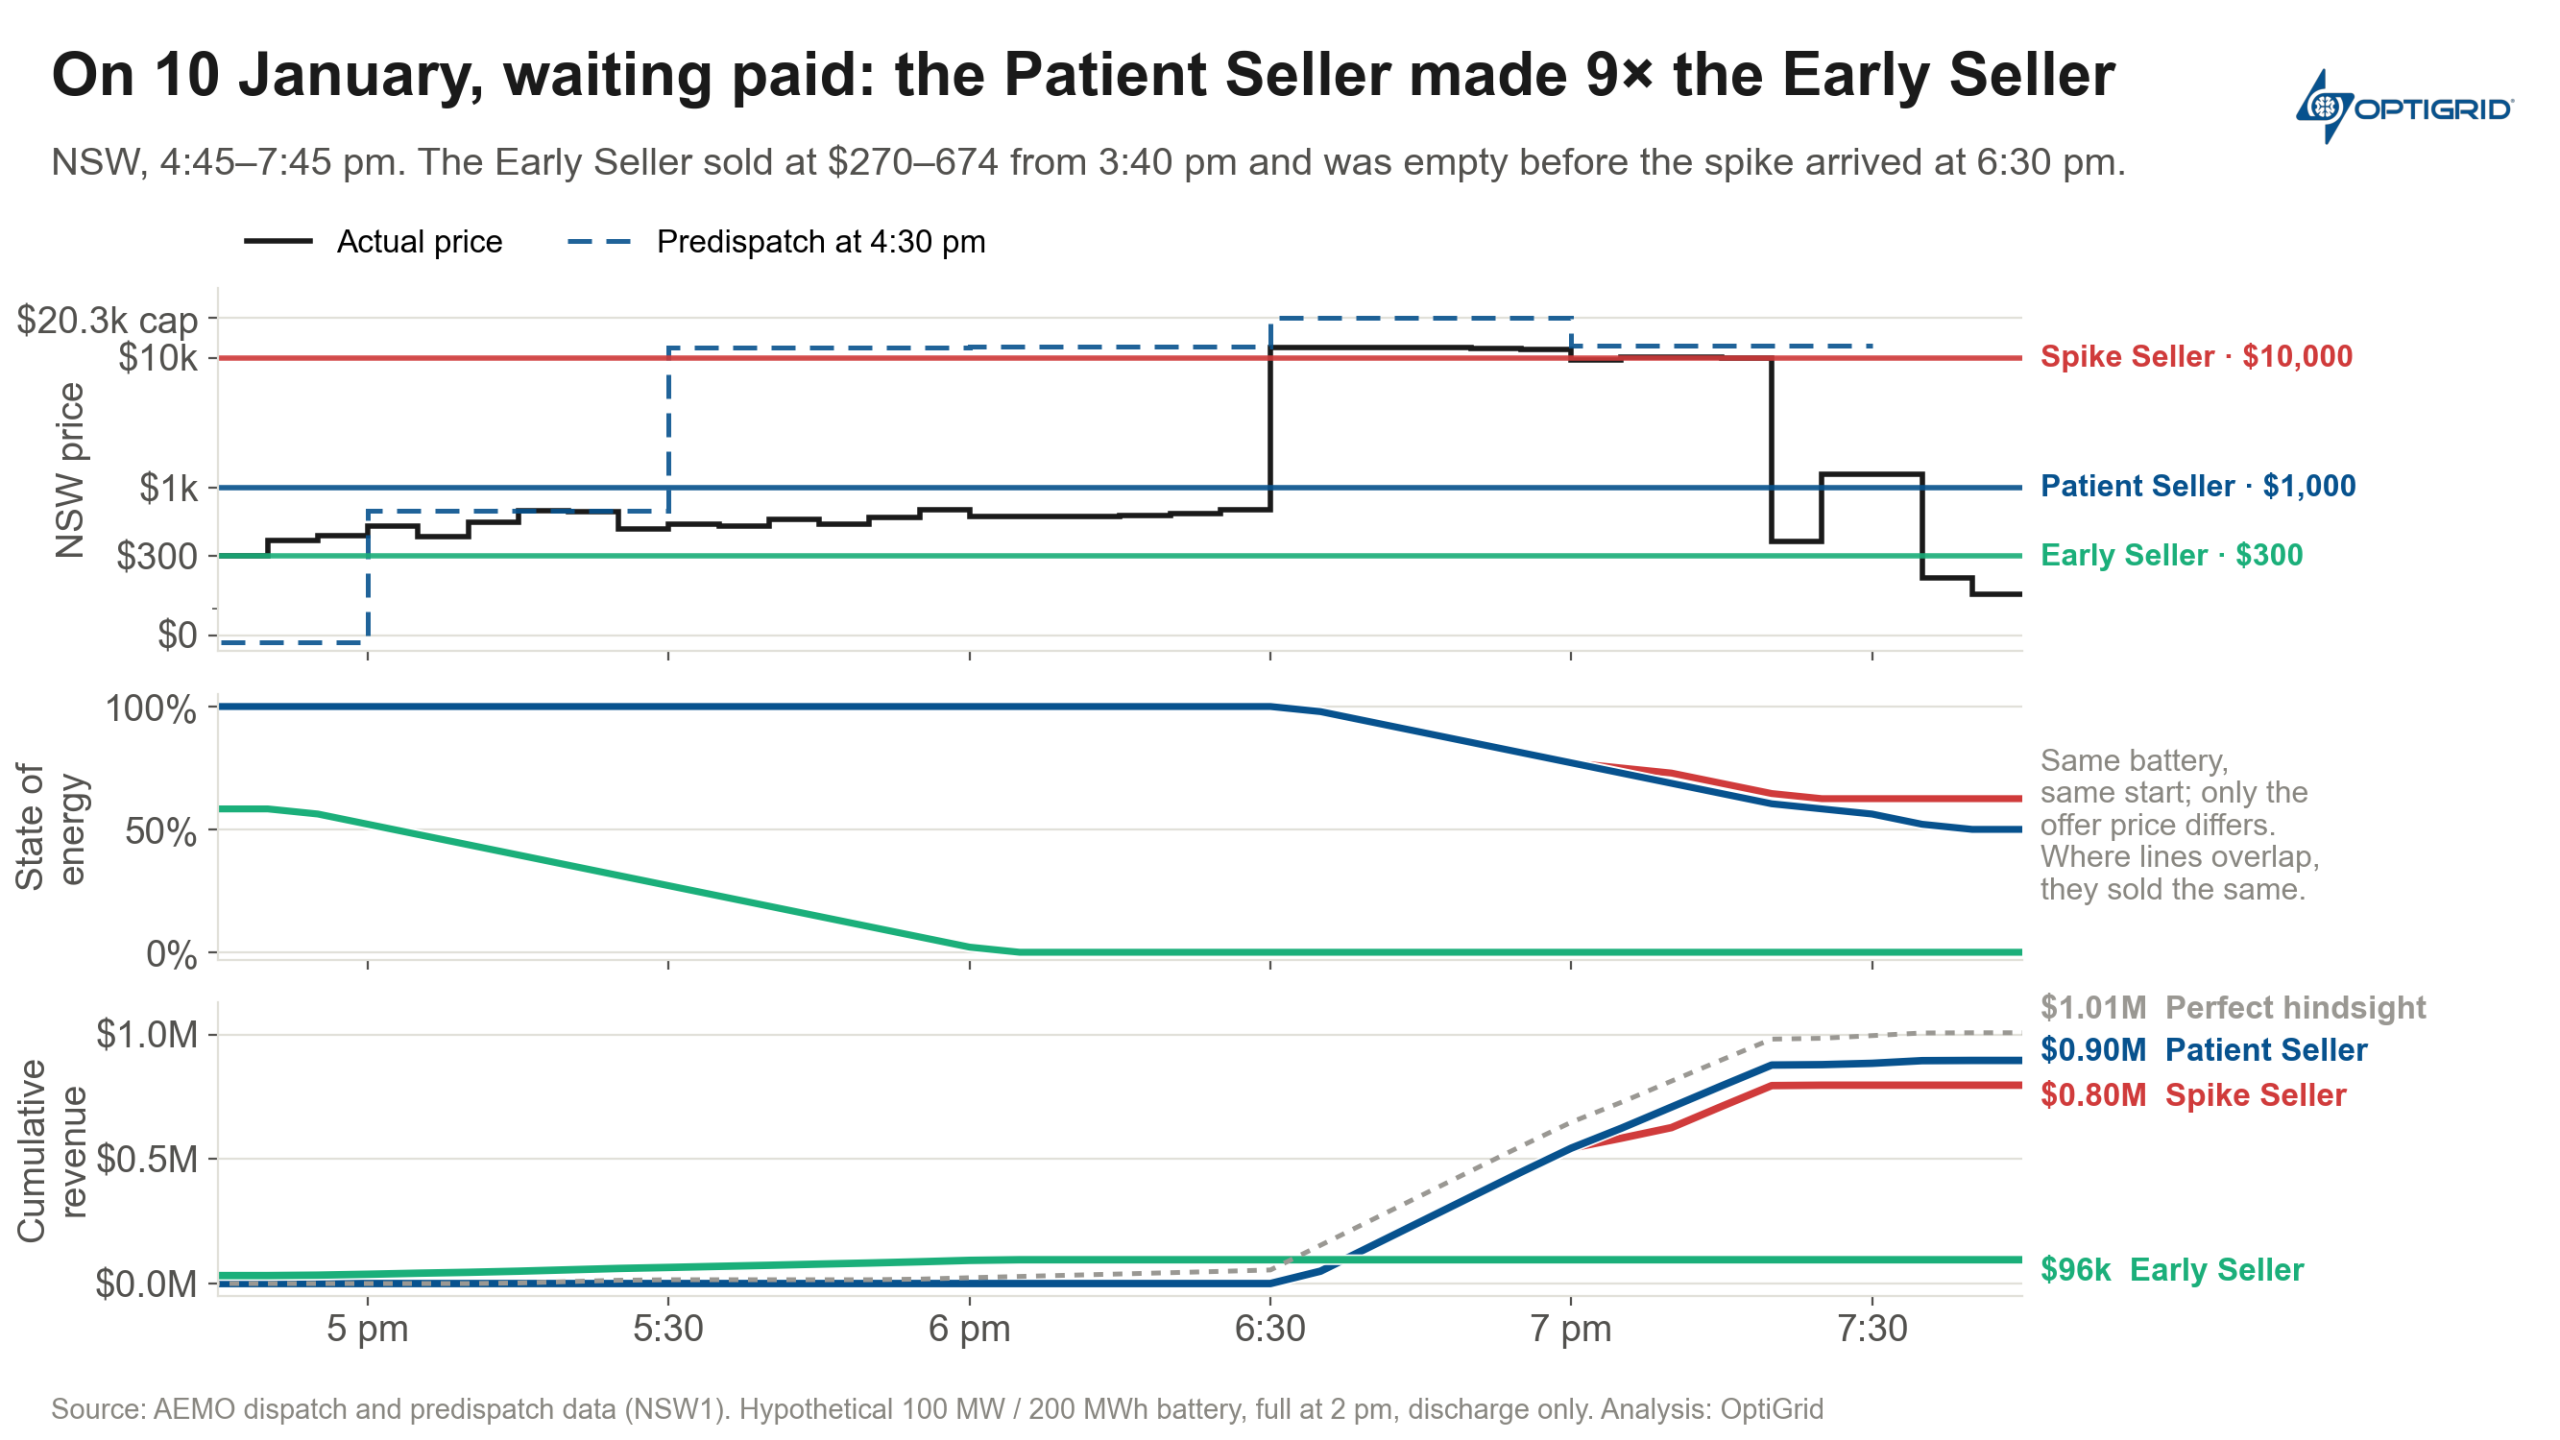
Figure 6. Performance outcomes of each strategy on 10 Jan 2026
While this is an obviously simplified example, the point is that there is no one-size-fits-all or set-and-forget approach when it comes to trading utility-scale batteries. And while the right strategy can appear obvious with hindsight, it won’t necessarily be the one that your business is comfortable taking at the time.
Adding contracts to the equation
The previous example assumed a fully merchant revenue profile, but most asset owners will look to secure some degree of contracted revenue. How different contract structures influence trading decisions could be an entire article itself, so for the sake of simplicity let’s take the same battery and assume the owner has sold 50 MW of a $300/MWh evening peak cap covering 5 pm to 9 pm. The owner receives a fixed premium and, in return, pays the difference between the spot price and the strike on 50 MW in every interval where prices exceed $300/MWh during the defined coverage period. 50 MW for four hours is 200 MWh, so a battery that is full at 5 pm can cover the cap in full.
To see what this means for trading, take the Early Seller from the previous example and compare it with an approach that aims to physically defend the sold cap (Peak Holder). The Peak Holder offers half its available capacity at $300/MWh, keeping the remaining 100 MWh back until 5 pm, enough to run 50 MW through the two hours that predispatch indicated would exceed the strike (5–7 pm). From 5 pm it discharges 50 MW whenever the price is above the strike.
Why hold energy back when prices are already $10,000/MWh or more for most of 2:15–3 pm? Because at 2:30 pm, predispatch showed prices at or near the market price cap from 5 to 7 pm, and the runs at 3, 3:30 and 4 pm still showed about $10,000/MWh or more for that period. With the cap sold, every MWh sold in the afternoon before the peak period leaves a MWh of potential exposure that is uncovered.
The Early Seller sold 183 MWh in the afternoon for $1.23 million, leaving only 17 MWh for the evening. If the evening had come as predispatched, it would have paid out $2.2 million under the cap and ended the day $0.60 million down.
The Peak Holder sold 100 MWh between 2 and 3:15 pm at an average of about $9,900/MWh, making $0.99 million, and would have used its other 100 MWh to cover the cap, ending $0.96 million up (Figure 7).
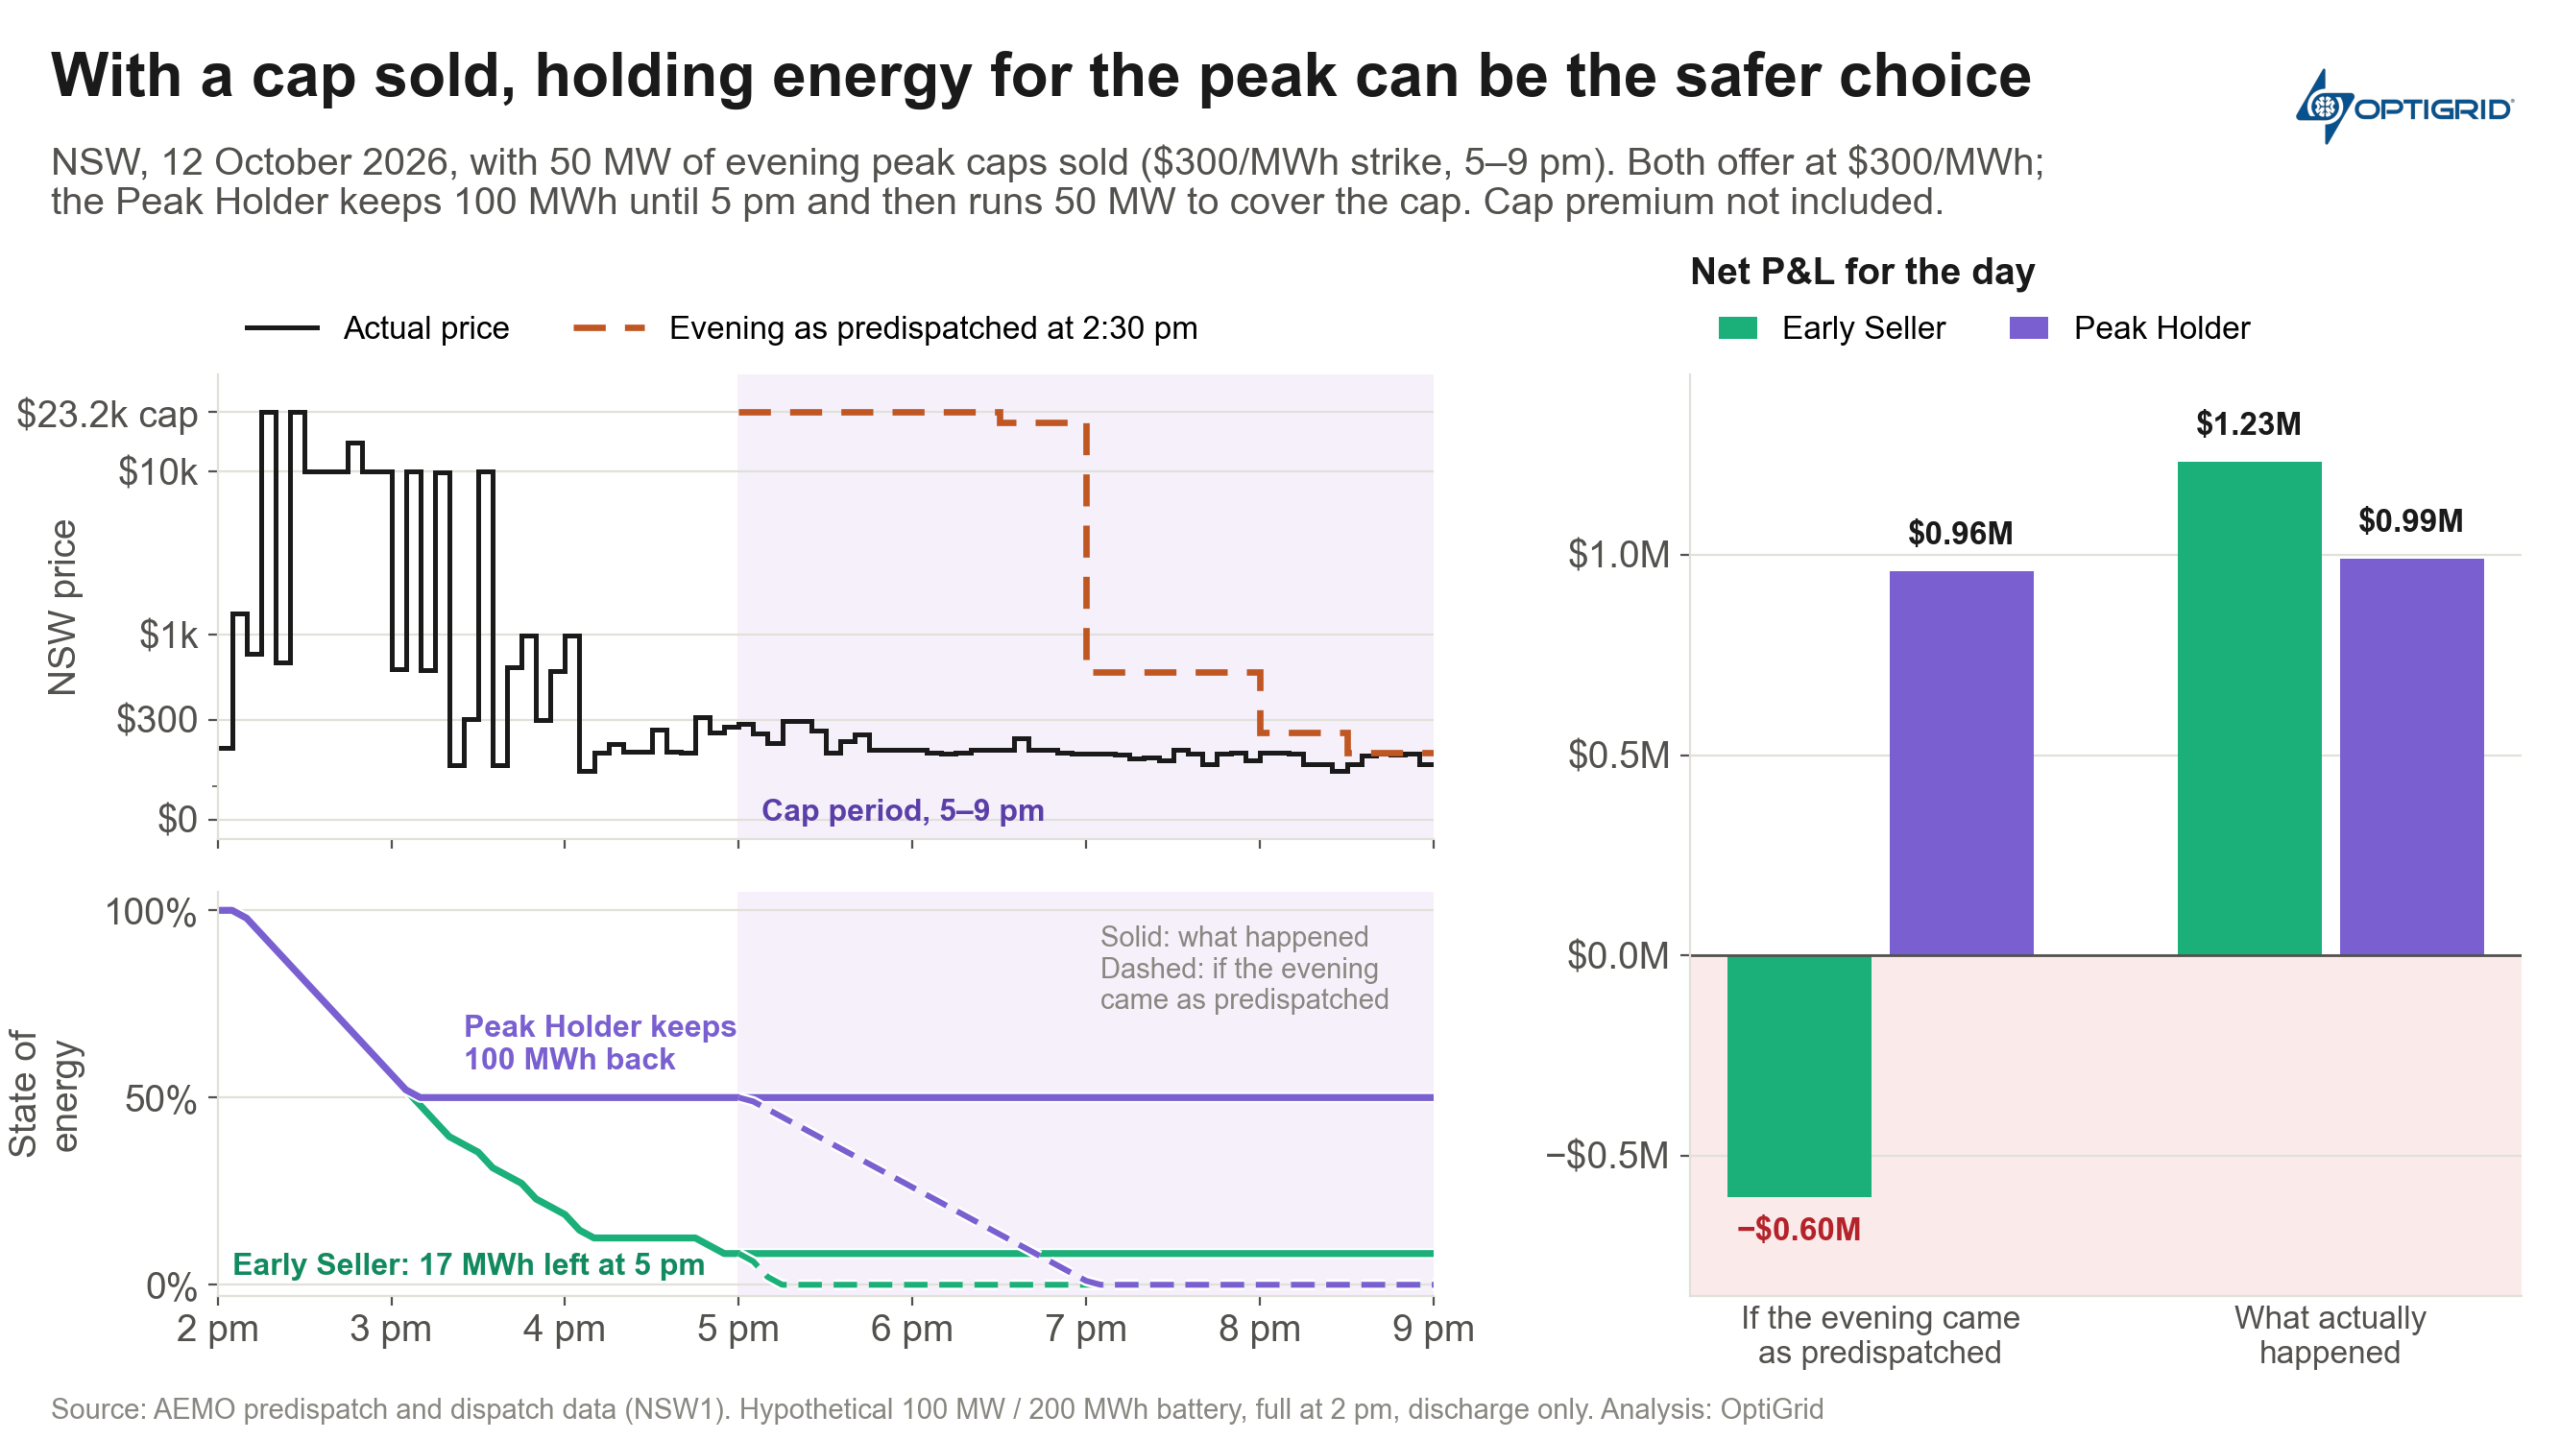
Figure 7. With a cap sold, holding energy to reduce value at risk can be the safer choice
As it turned out, evening prices that day stayed below $300/MWh and the cap paid out nothing. The Early Seller finished $0.24 million ahead of the Peak Holder. That $0.24 million is the cost of holding energy to manage the risk. In return, the Peak Holder’s result barely changed based on how the evening turned out ($0.96–0.99 million), while the Early Seller’s ranged from a $0.60 million loss to a $1.23 million gain.
Different contracts create different pressures, but they all result in a change in the nature and quantum of the risk being managed. A swap adds two-way exposure, so low prices matter as much as high ones. A virtual tolling agreement transfers much of the trading outcomes to the offtaker, and the owner’s exposure shifts towards how closely physical dispatch tracks the virtual battery.
A quick nod to the benefit that portfolios bring
Owning more than one battery changes the picture again. Selling a firm contract like a cap can carry higher risk if sold from a single asset instead of a portfolio. To highlight this, let’s look at 12 October again. On that day, location also mattered: network constraints limited output from many batteries in the south of NSW, while northern batteries were able to earn substantially more on the day.
If you had sold a cap off a battery that happened to be limited by those constraints, you could not have defended it in some of the high-price periods even if you had wanted to.
Avoiding FOMO with more meaningful performance comparisons
Even from these few examples, it should start to become clear why it can be challenging to compare performance on a like-for-like basis across utility-scale batteries. While the trading outcomes are publicly available, the underlying drivers seldom are.
That isn’t to say there is no value in comparing performance across assets. But the more useful question is how close your own battery came to the best outcome it could realistically have achieved, given its strategy, contracts and constraints, and why it fell short.
Answering that requires a credible benchmark: one that reflects how the battery could realistically have traded, interval by interval, within the same technical, network and commercial limits it is actually subject to. With that in place, the remaining gap between actual and achievable revenue can be broken down into roughly three distinct drivers:
- Your risk tolerance and associated limitations placed on trading decisions
- The influence of contracted positions and/or wider portfolio-level decisions
- Forecasting & optimisation quality
Ultimately, if you can’t drill down on why your battery fell short, you can’t make its trading more efficient.
Conclusions
Most of this article has focused on the first two performance drivers outlined above, but the value uplift that better price forecasting and optimisation bring in the context of the NEM is highly material.
Not all optimisers are created equal, and the variances in forecasting accuracy, optimisation robustness, and approach to handling certain variables make a substantial difference to real-world performance outcomes no matter what you are trying to achieve with your trading strategy.
Your risk tolerance, contracts and portfolio positions guide what a battery should be trying to do to support the most valuable outcome for your business, but the quality of the optimiser is what determines how much of this value can actually be captured.
With that in mind, I will leave you with a few questions that, once answered, can make battery trading in the NEM a lot less daunting and much more fun:
- What is our risk appetite, and can it be expressed in numbers?
- How might our risk-return profile change in the presence of the contracts we want to enter or as we grow our asset portfolio?
- Are our trading strategies able to achieve the outcomes we need to support the returns needed with an acceptable level of risk?
- Do we know to what extent our performance outcomes reflect our preferences/trading strategies or our optimiser?
The analysis required to answer these types of questions is core to how the team at OptiGrid support our customers and improve our own optimisation platform. And if anyone tells you that working out this more detailed approach to performance is simply too hard, what they might really mean is that it is too hard for them.
About our Guest Author
 |
Henry Swisher is Chief Growth Officer at OptiGrid, an Australian bidding optimisation and trading intelligence platform for hybrid and stand-alone batteries operating in Australia’s National Electricity Market. He has over a decade of experience advising on electricity market modelling, transactions, offtake structuring and risk management strategy for renewables and energy storage. At OptiGrid he leverages this expertise to help clients unlock the full value of the platform’s capabilities, while informing product design and commercial strategy for the business.
Prior to OptiGrid, Henry was part of the senior management team in Baringa Partner’s Energy & Resources practice. Originally from California, Henry has worked across multiple markets globally including New Zealand, Japan, North America (CAISO, ERCOT, PJM) and the UK with a consistent focus on helping energy businesses navigate evolving markets, adopt innovative technologies, and build resilient commercial strategies. You can find Henry on LinkedIn here. |
Can you inform me something. Lithium Batteries do not lie being fully discharged or fully charged
The 20 / 80 rule comes to mind to preserve battery life
How does this effect the use of the big batteries to be financially optimal
I am not a robot.