
Earlier this afternoon, the spot price in the NSW region reached the Market Price Cap (MPC) in a short-lived but curious price spike. This short note captures a few quick observations about some of the dynamics involved, and looks towards the AEMO’s P5 forecasts for prices in the region later this afternoon.
Starting from the 12:15 dispatch interval, the NSW spot price jumped to $14,975/MWh, then climbed further to $20,300/MWh for the 12:20 interval, before subsiding back towards typical levels shortly after. Neither of these spikes were anticipated in AEMO’s P5 pre-dispatch price forecasts, which showed prices remaining benign throughout the middle of the day period.

Starting from the 12:15 dispatch interval, the NSW region saw a two-interval price spike, before prices began to subside.
Source: ez2view’s Trading Prices Widget. Screenshot taken at 12:35 NEM time.
Interestingly, during these intervals we also saw a large counter-price flow on the VNI interconnector, with NSW exporting to VIC — as shown in the 12:20 dispatch-interval screenshot below. In that particular interval, the counter-price flow occurred despite the NSW price being $20,336 higher than that in VIC. Adding to the curiosity, Victoria’s utility-scale batteries were collectively consuming around 487 MW at the time of this interval. We can see that the Negative Residue Management constraint kicked in on VNI at the 12:20 dispatch interval, to set the import limit for the interconnector.

The spot price in NSW spiked to $20,300/MWh for the 12:20 dispatch interval, with the VNI interconnector seeing a target flow of -404 MW (i.e. representing southward flow).
Source: ez2view’s NEM Map Widget. Screenshot taken at 12:20pm NEM time.
This unexpected price volatility coincided with a sharp jump in NSW market demand relative to the surrounding intervals — a change clearly visible when we look at the blue series in the chart below. The sharp rise was material enough to quickly tighten supply–demand and would be one of the reasons why several constraint equations bound during this time (more on that below).

NSW market demand saw a sharp increase during the two intervals where the spot price spiked.
Source: ez2view’s Trend Editor Widget. Screenshot taken at 12:45pm NEM time.
The quick rise in market demand in NSW appears to have coincided with a large cloud bank drifting west-to-east across the Sydney metropolitan area — cutting rooftop PV output across the region’s largest population centre. This reduction in behind-the-meter generation would have flowed through to higher (net) market demand.
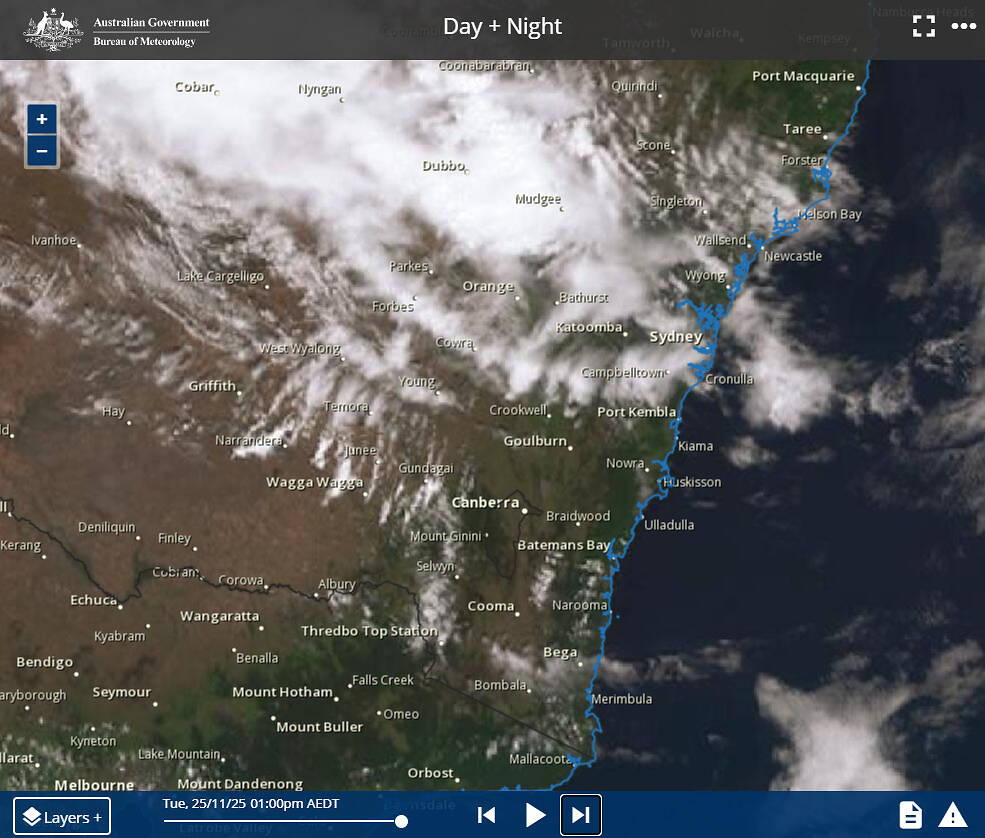
A cloud bank drifted west-to-east, to cover the Sydney metropolitan area, likely cutting rooftop PV generation.
Source: BOM. Screenshot taken at 12:00pm NEM time / 1:00pm local time.
A quick look at our Congestion Map in ez2view (screenshot below) gives us a glimpse into some of the supply-side and network dynamics that occurred either due to, or simultaneously during, the rise in demand.
In the screenshot taken during the 12:20 dispatch interval, we can see a cluster of constraint equations with relatively high marginal values were actively shaping dispatch outcomes in NSW. In particular, I’d highlight:
-
N::N_CNLT_2 — a transient stability constraint invoked due to the outage of the Lower Tumut–Canberra 330 kV line. This constraint affects units across the south-western half of NSW.
-
N>>NIL_85_86_S — a system-normal thermal constraint impacting generation in northern NSW.
-
N>PKTX_TX_NIL — a thermal constraint invoked due to the outage of one of the 132/66 kV transformers at Parkes, affecting two nearby units.
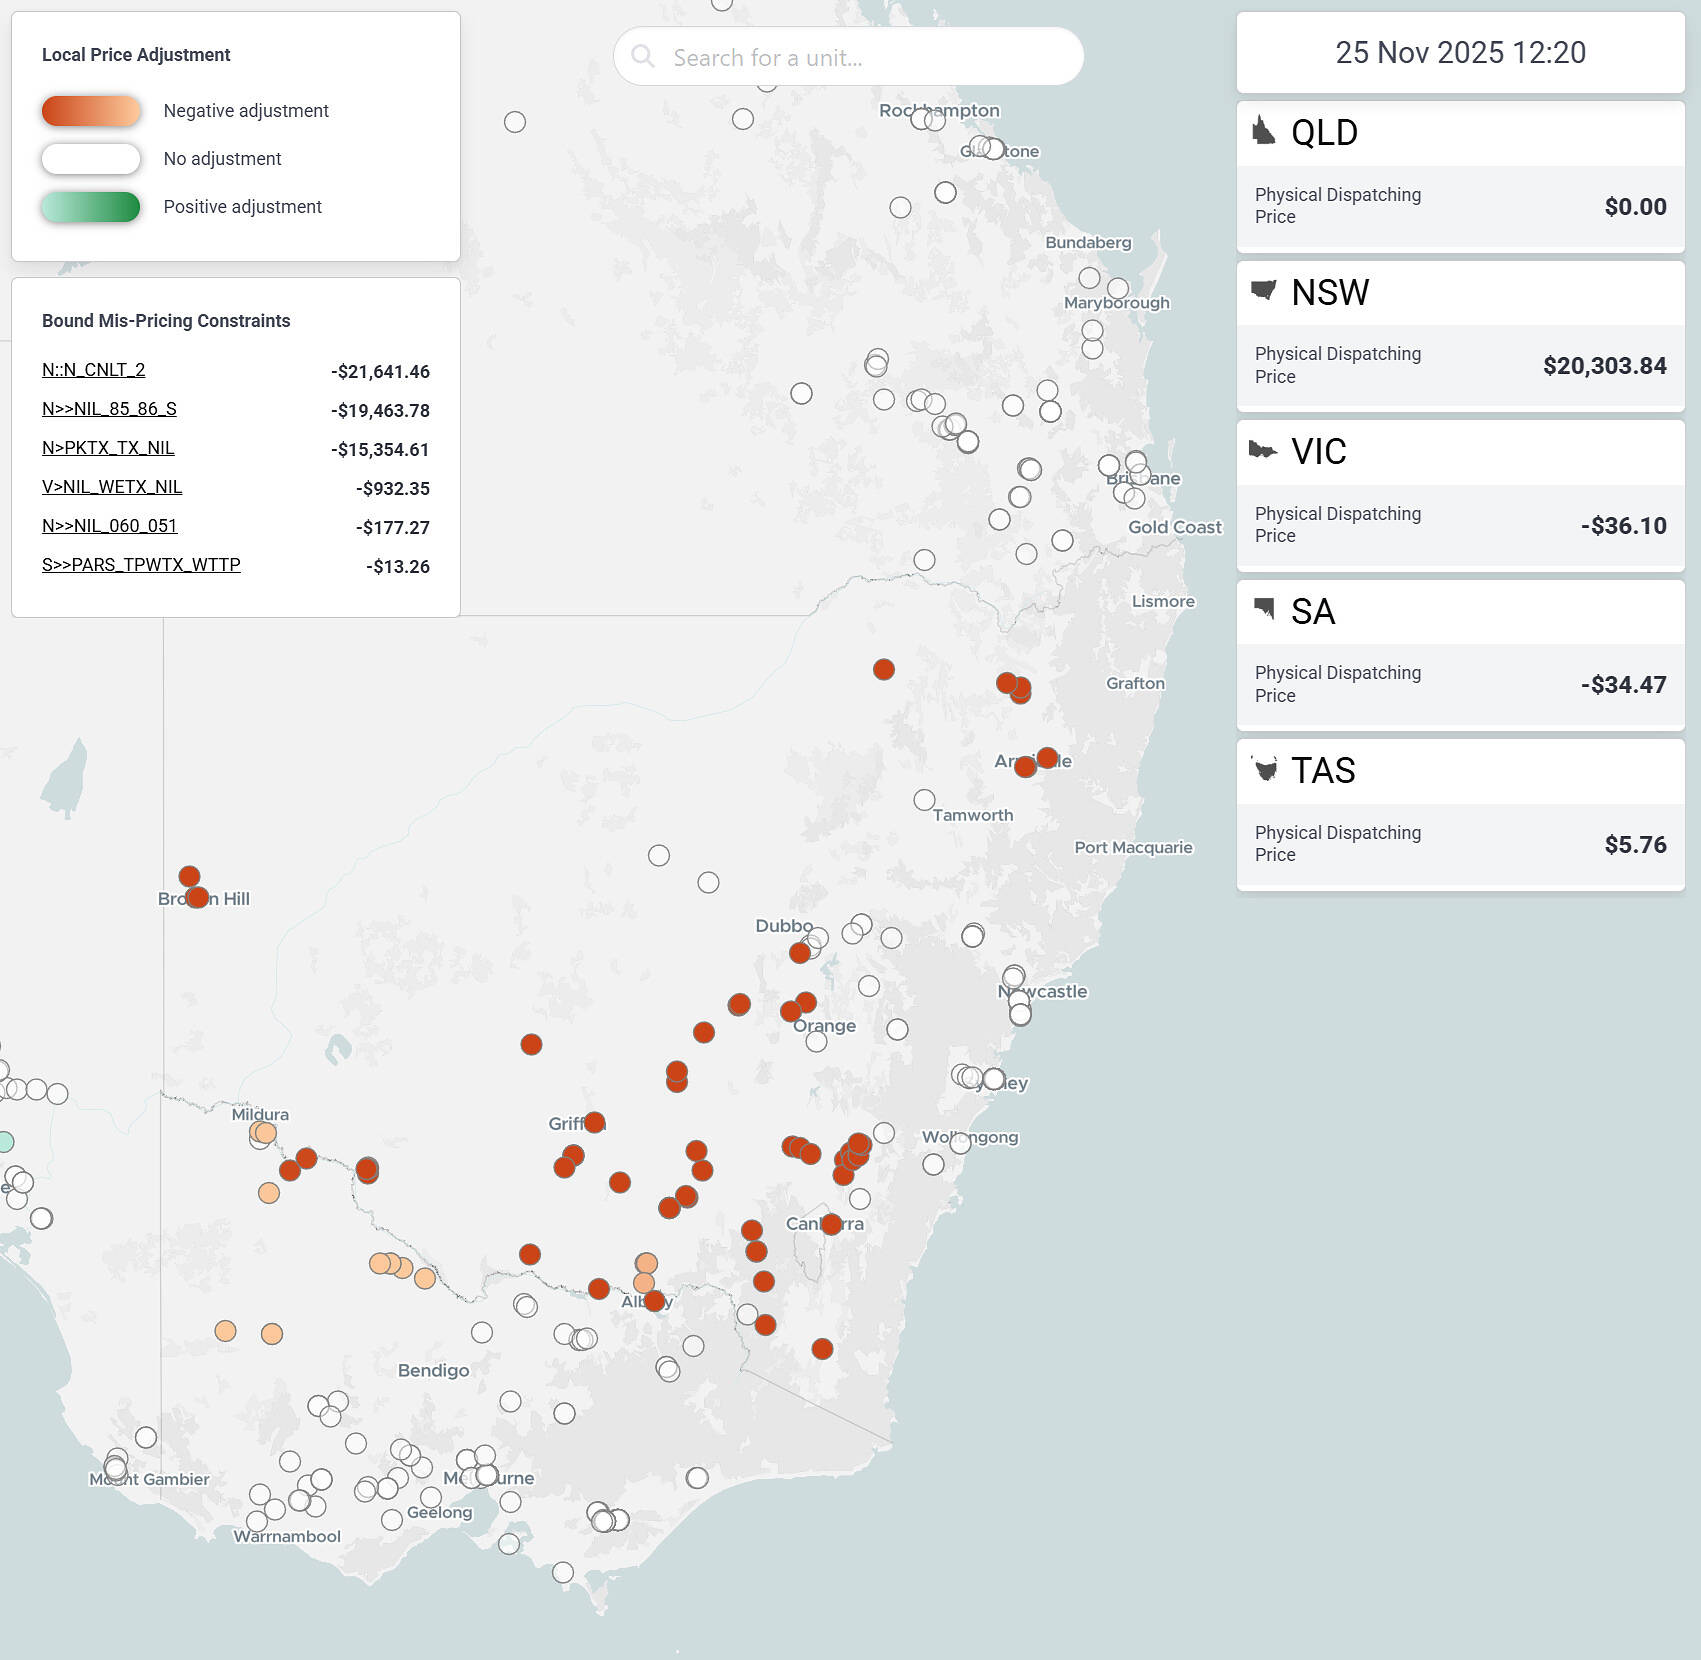
Three simultaneously binding constraint constraint equations with high marginal values, in particular, were impacting dispatch outcomes in the NSW region. Each of these constraint equations affected different geographic pockets of NSW, collectively limiting the region’s ability to respond to the sudden rise in demand.
Source: ez2view’s Congestion Map Widget. Screenshot taken at 12:20pm NEM time.
As at 1:55pm NEM time (2:55pm Sydney time), the AEMO’s P5 forecast model is currently project further price spikes later this afternoon, with another projected spike to the MPC for the 14:45 dispatch interval. We’ll be keeping an eye on whether those projected high prices eventuate or not.
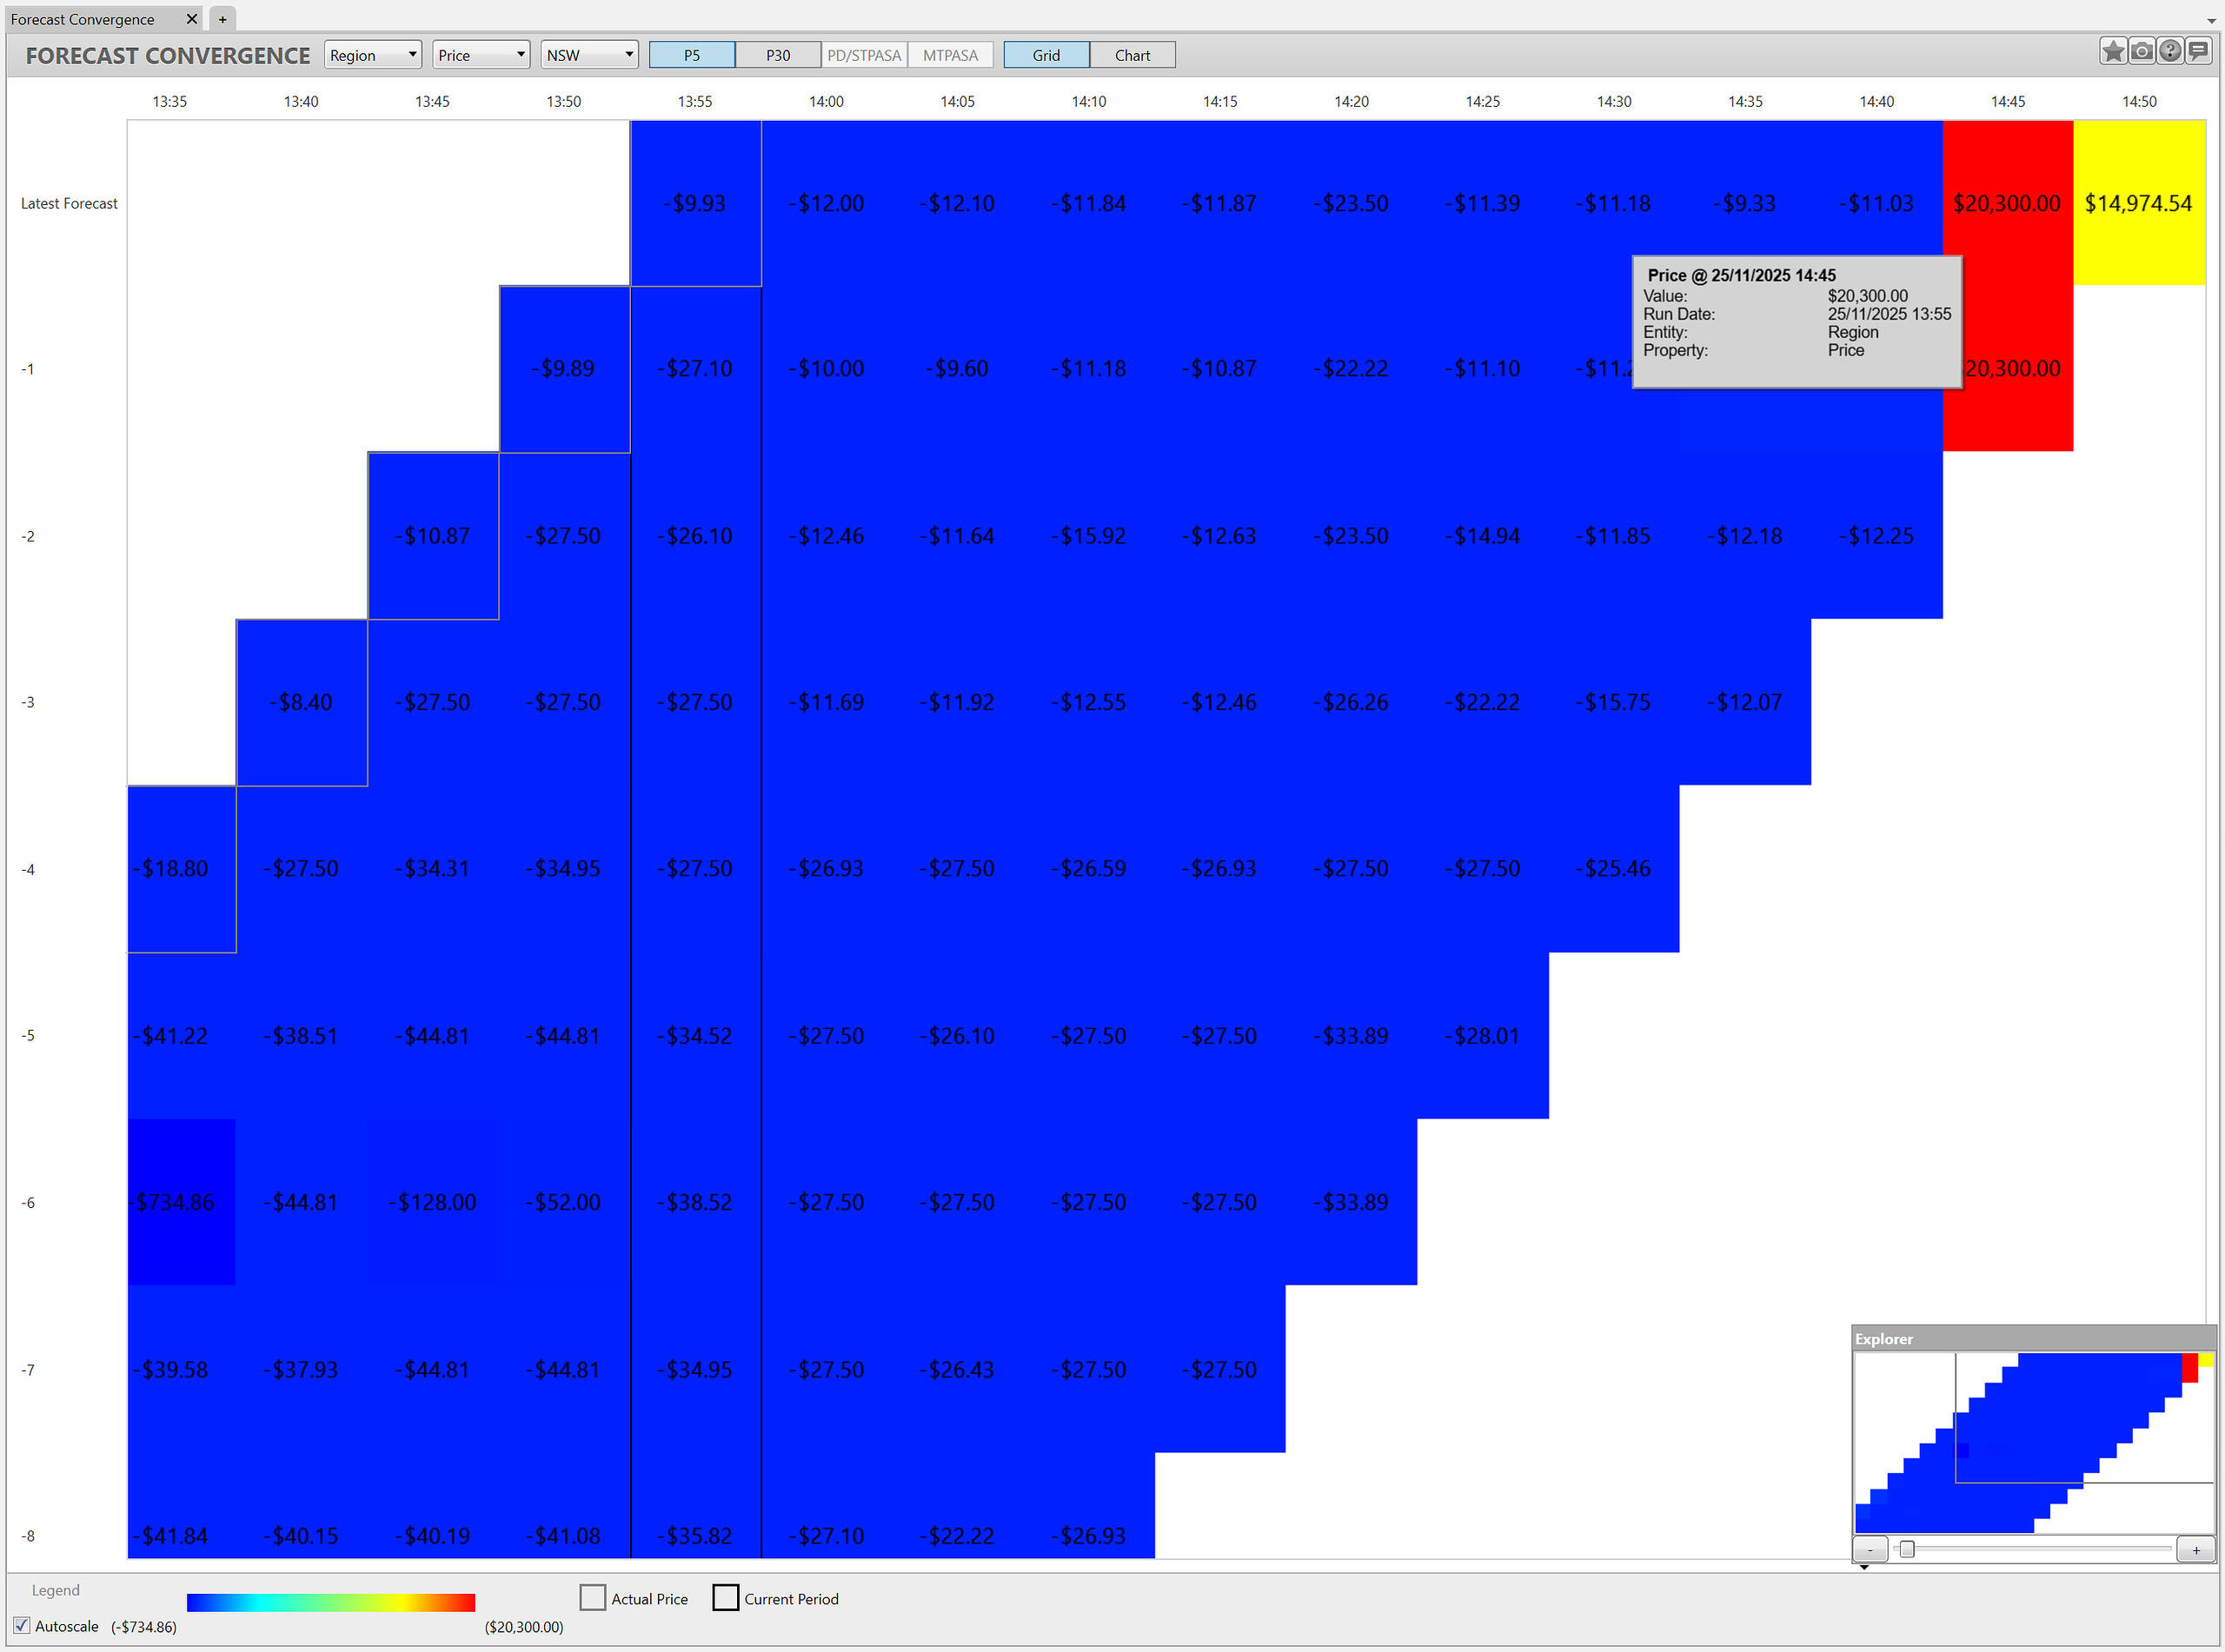
Our forecast convergence widget shows that the AEMO’s P5 pre-dispatch model is currently projecting high prices again later this afternoon.
Source: ez2view’s Forecast Convergence Widget. Screenshot taken at 1:55pm NEM time.
Very interesting dynamics on the constraints.
N>>NIL_85_86_S definitely hit max at 12:10, but I think N::N_CNLT_2 is an interesting feature.
Based on dispatch constraints…
N::N_CNLT_2 was at capacity the entire time, but around 12:15 it suddenly had the RHS drop by 300MW.
https://nemview.hgn.id.au/graph/dispatch_constraint/N::N_CNLT_2
I would guess this had a ripple effect combined with…
I also notice the NSW Wind was mostly unconstrained up to 12:15, and constrained down about 60% for the rest of the day.
Quite the interesting day.