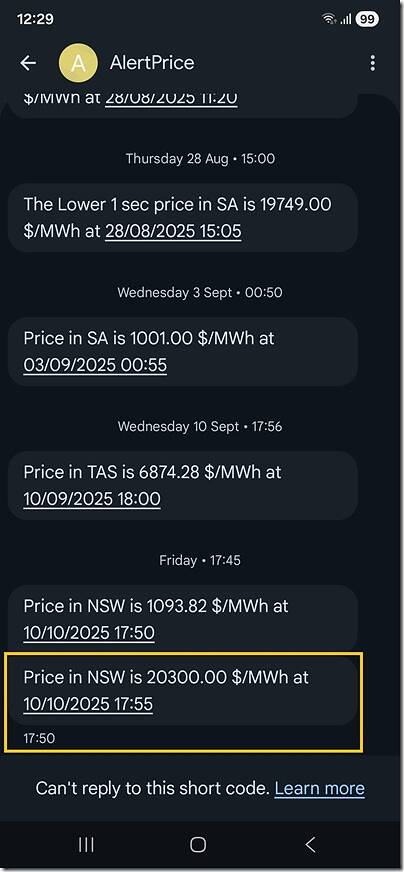
There was a short-lived (but interesting) price spike for ENERGY in the NSW region on Friday evening 10th October 2025, as captured in these SMS alerts:
… it’s the 17:55 spike to the Market Price Cap ($20,300/MWh) that we’ll focus on in this first-pass Case Study.
A useful exercise, at several levels
First and foremost, it’s a useful exercise to drill into what happened in order to understand more about the mechanics of NEMDE under several overlapping complex commercial and physical conditions in the market.
But it’s also useful to reflect on the commentary I’ve already seen in various corners of social media. Just like there is a diversity of views espoused on the Emotion-o-meter, there also seems to be a diversity of views, including these:
Perspective #1) There are some who take the approach of appreciating that the NEM is a complex place – and that the simplistic ‘bid stacking’ model only really applies fully not as often as one might initially think (or desire) is the case.
Perspective #2) Whereas others (who remind me of Gary Larson’s 4th personality type) seem to take the approach that ‘if it’s complex and I don’t understand it, then there must be a conspiracy afoot!’
A summary view of the NSW Region
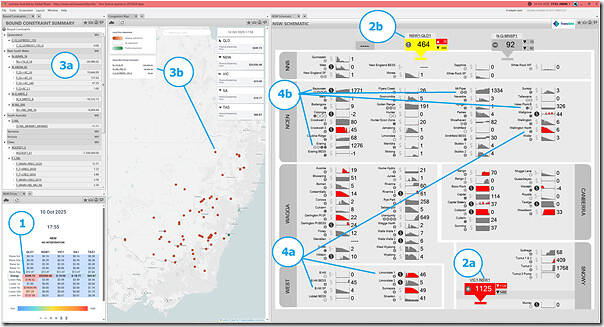
Utilising the ‘Time-Travel’ function in ez2view, we wind the clock back to the 17:55 dispatch interval (NEM time) to gain an overview of what was happening at the time:
There’s plenty there which we could point to – but I’ve picked out a few things to highlight here:
1) Not only did the price for ENERGY spike in NSW, but we also see elevated prices in QLD (for ENERGY but especially for Lower FCAS Contingency services).
2) There’s constrained flow on the interconnectors:
(a) There’s counter-priced flow on VIC1-NSW1, and
(b) there’s also constrained flow on QNI (but at least there we see that the flow is in the direction of the price differential).
3) There’s also plenty of constraint activity across the NEM:
(a) A large number of bound constraint equations;
(b) With three of these bound constraint equations contributing to ‘mispricing’ (by the AEMO logic) are driving deep negative Local Price Adjustment across almost all of the NSW units;
4) With respect to unit outputs:
(a) We can clearly see (and it’s no surprise) that at the 17:55 dispatch interval (NEM time) on a mid-spring evening, the yield from NSW solar farms has declined to not much.
(b) There are 4 coal units offline (of the 12 remaining in NSW after Liddell closed), including:
i. VP5, which is on its long outage following ‘turbine vibrations’;
ii. ER03 (that outage we’ve written about before) and ER04 (a long planned outage);
iii. BW04, on a long planned outage.
(c) Plus other activity
We’ll keep this in mind as we walk through a couple things…
Interconnector activity
With respect to the interconnectors either side of the NSW region (and remembering that an ‘interconnector’ refers to the whole of the transmission path between adjoining RRN), we’ll take a quick look at both:
The QNI interconnector
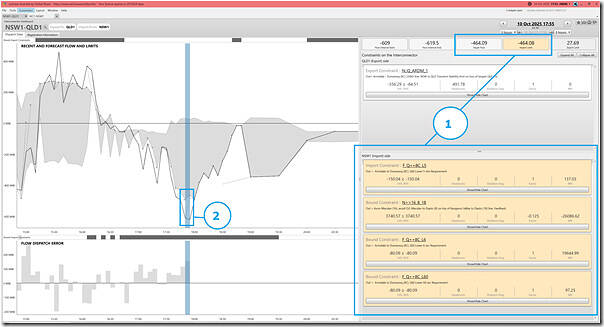
Starting with the ‘easy’ one we see the following (in a newly updated version of the ‘Interconnector Dashboard’ widget in ez2view v9.14 released during the past week):
I’ve highlighted two things here:
1) There are four discrete (bound) constraint equations that are combining to drive flows southwards at the limit;
2) Indeed, we see the ‘end of interval metered flow’ was considerably greater (flowing south) than the Dispatch Target flow on the interconnector.
… so the interconnector has a large positive Dispatch Error, in a way.
The VIC1-NSW1 interconnector
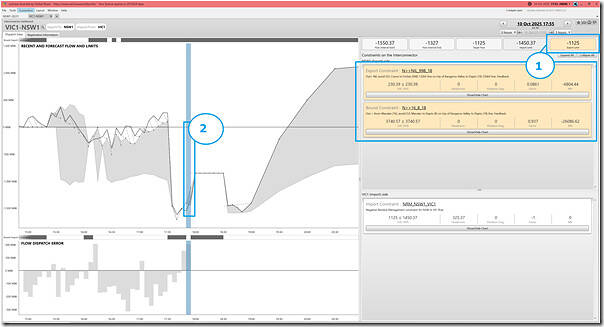
Moving to the south, we see the following:
I’ve also highlighted two things here:
1) There are two discrete (bound) constraint equations that are combining to affect the ‘export’ limit for the VIC1-NSW1 interconnector;
2) We can see that these constraints:
(a) Combined to set an ‘export’ limit (which would ‘normally’ be a positive number, representing flow north) to make VIC1-NSW1 flow heavily south (i.e. which is clearly counter to the price direction);
(b) With the ‘export’ limit not all that far away from the ‘import’ limit;
Bound Constraint Equations
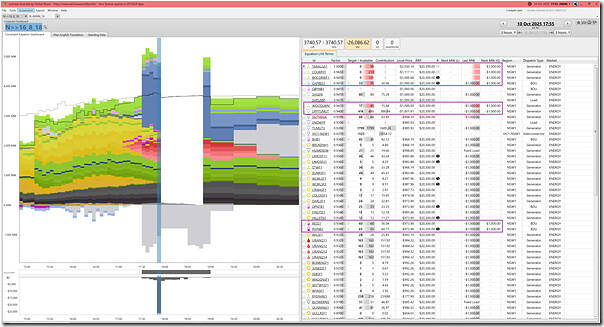
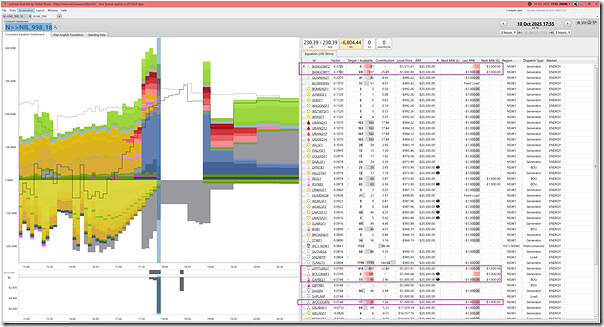
Remembering that there are numerous constraint equations, and we’ll include snapshots of just 3 (using the ‘Constraint Dashboard’ widget in ez2view v9.14), but won’t have time to comment much (though have annotated a few things):
The ‘N>>16_8_18’ Constraint Equation
In the first case, we’ll look at the ‘N>>16_8_18’ constraint equation, which is an outage-related constraint equation:
This is a member of the ‘N-AVMN_16’ constraint set, which is one we’ve not seen before – but which relates to an outage on the Avon to Marulan (16) 330kV line:
1) Which is adjoined to the Avon to Macarthur (17) 330kV line, which we have seen a number of times before;
2) And more generally represents one of the 330kV lines in Southern NSW that we watch for.
The ‘N>>NIL_998_18’ Constraint Equation
In the second case, we’ll look at the ‘N>>NIL_998_18’ constraint equation, which is a ‘System Normal’ constraint equation:
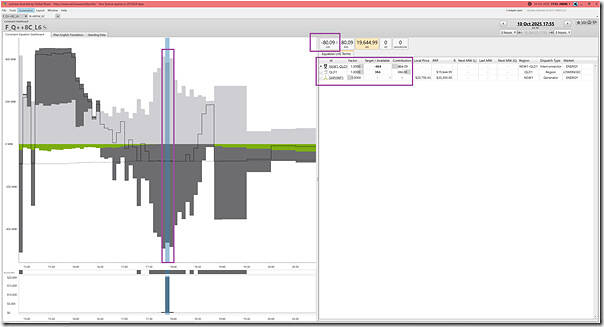
The ‘F_Q++8C_L6’ Constraint Equation
Lastly, we’ll take a look at the ‘F_Q++8C_L6’ constraint equation, which is bound with a marginal value of $19,644.99/MWh and is the driving reason why the Lower 6second (Contingency FCAS) price has cleared at that same price:
Bidding Behaviours
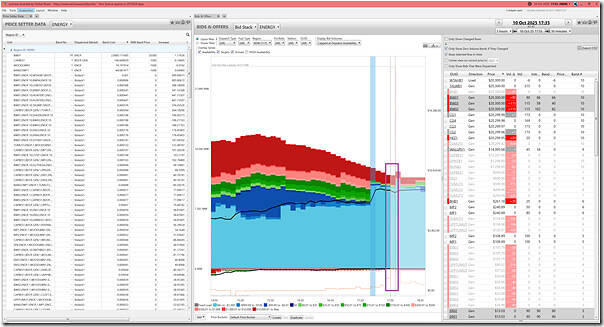
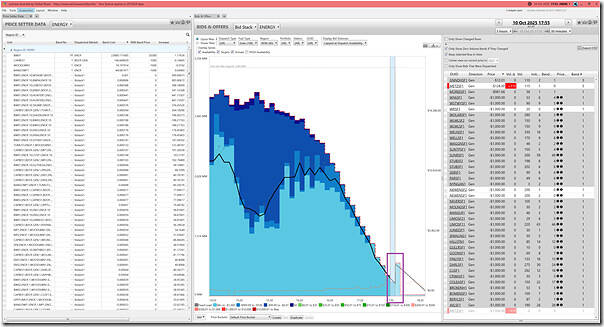
Let’s just take a quick fly-through the bidding behaviour for the ENERGY market of suppliers in the NSW region (using the ‘Bids & offers’ widget in ez2view v9.14), but won’t have time to add comments here:
All units in NSW
In the first case, we’ll look at all NSW-based units … remembering that (post IESS) ez2view shows BDU consumption bids as negative ones, and also the same for Shoalhaven and Snowy pumping:
At a high level, we can see:
1) not much spare capacity left after dispatch,
2) with aggregate dispatch in NSW up considerably in the last few dispatch intervals (since HH:MM)
(a) as a result of rebids jamming capacity down to the –$1,000/MWh (at the RRN) Market Price Floor bid band;
(b) at least some of it presumably related to the machinations of the ‘N>>16_8_18’ constraint equation.
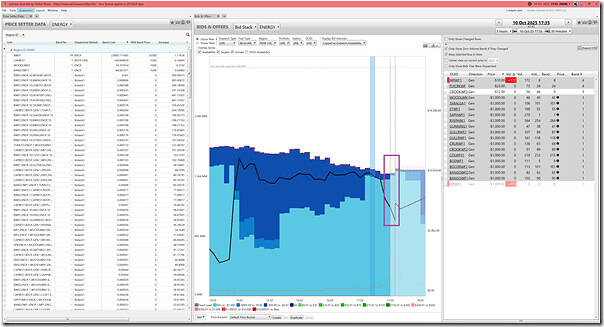
Solar Farms in NSW
Now we’ll narrow down to just the Semi-Scheduled Solar Farm units in NSW:
Not much capacity left for end-of-day, but an interesting spike in bids anticipated for the next dispatch interval.
Wind Farms in NSW
Now we’ll narrow down to just the Semi-Scheduled Wind Farm units in NSW:
Note the drop in output, with energy ‘constrained down’ due to network congestion.
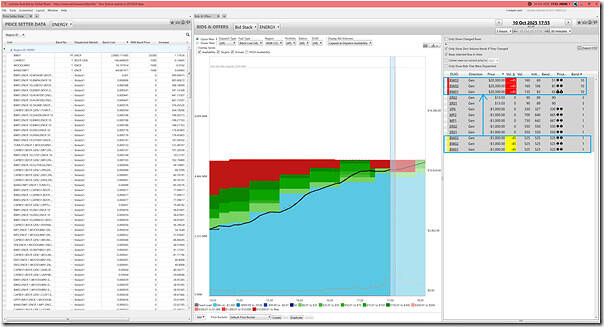
Coal units in NSW
Now we’ll narrow down to just the NSW coal units:
Note:
1) available capacity heavily utilised;
2) with some repricing of capacity at the 3 x Bayswater units that are running on this evening.
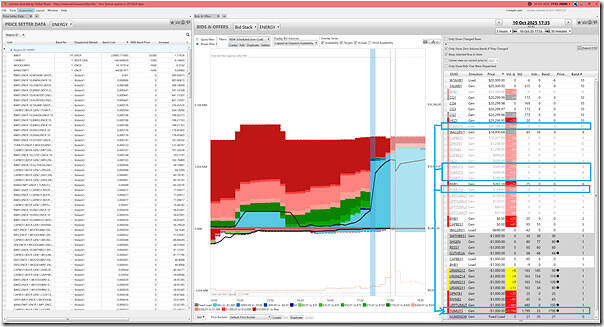
(Non-coal) Scheduled units in NSW
Now we’ll narrow down to all of the rest of the NSW (fully) Scheduled units, excluding the coal units:
And that’s where we’ll leave Part 1 at this point.


Leave a comment