
FPP
The Frequency Performance Payments (FPP) arrangements represent two related mechanisms.
- One to recover the cost of regulation FCAS and
- the other to reward provision of primary frequency response (PFR).
Readers seeking an extended background in what the FPP arrangements are will find the resources linked in Two diagrams to help illustrate the changes coming with FPP (Frequency Performance Payments) of value.
The NFO period provided indications
The mechanism switched to full financial operation on 8 June 2025. In the leadup, during non-financial operation (NFO), Jack Fox identified possible winners and losers.
Generator exposure to regulation FCAS recovery was anticipated in Generator exposure to regulation costs under FPP and wind and solar units made up the top 10 list of units with the largest negative contribution factors (i.e. likely higher cost allocation).
In general batteries were identified as the biggest winners by a clear margin in The top 10 batteries under FPP.
An initial review of financial operation
This article aims to make an initial review of payment and cost outcomes of the first 44 days of financial operation of the arrangements, without yet delving down to technology and unit differences.
Notes for the next sections
Rewards for PFR provision are recovered from other units and participants. Therefore total PFR values represent amounts paid and equal the amounts recovered.
Costs for regulation FCAS are now changed under the FPP arrangements. Previously they were allocated with the Causer Pays approach.
For both mechanisms, costs (or payments) reflect the need for, and contributions to, raising or lowering frequency from units in each area where a regulation FCAS requirement is set. They also reflect the cost of meeting each regulation FCAS requirement.
Typically the regulation FCAS enablement is set from units in regions on the mainland and separately for Tasmania. In come cases there is a global requirement that is met by enablement from all units in all regions, which we label ‘NEM’ in the charts below.
The first 44 days in review
We restrict out analysis in this article to the high-level, presenting aggregate dollar values by day.
The chart below, inspecting differences between PFR and regulation recovery, and service (bid type) uncovers:
- Frequency-raise needs dominate (RAISEREG bid type).
- We’ve seen costs due to requirements for the mainland and separately for Tasmania, and occasionally for all regions (NEM). The chart is split by these areas.
- The highest cost event to-date was on the 12th June 2025.
- Costs for both PFR and Regulation recovery were high.
- This makes sense as both depend on the price of regulation FCAS services.
- Costs allocated to TAS participants on the 12th were higher than the costs allocated to mainland participants due to regulation recovery.
- Costs for both PFR and Regulation recovery were high.
- Mean daily values are clearly biased higher by the infrequent extreme days. Nevertheless, they suggest:
- Mainland costs for FPR are higher than for regulation FCAS recovery,
- TAS regulation FCAS recovery is higher than mainland recovery cost, and
- There is a possible indication that TAS mean costs are anomalously high given values in the second half of the period is far lower, and/or that there is greater regulation FCAS price volatility in TAS.
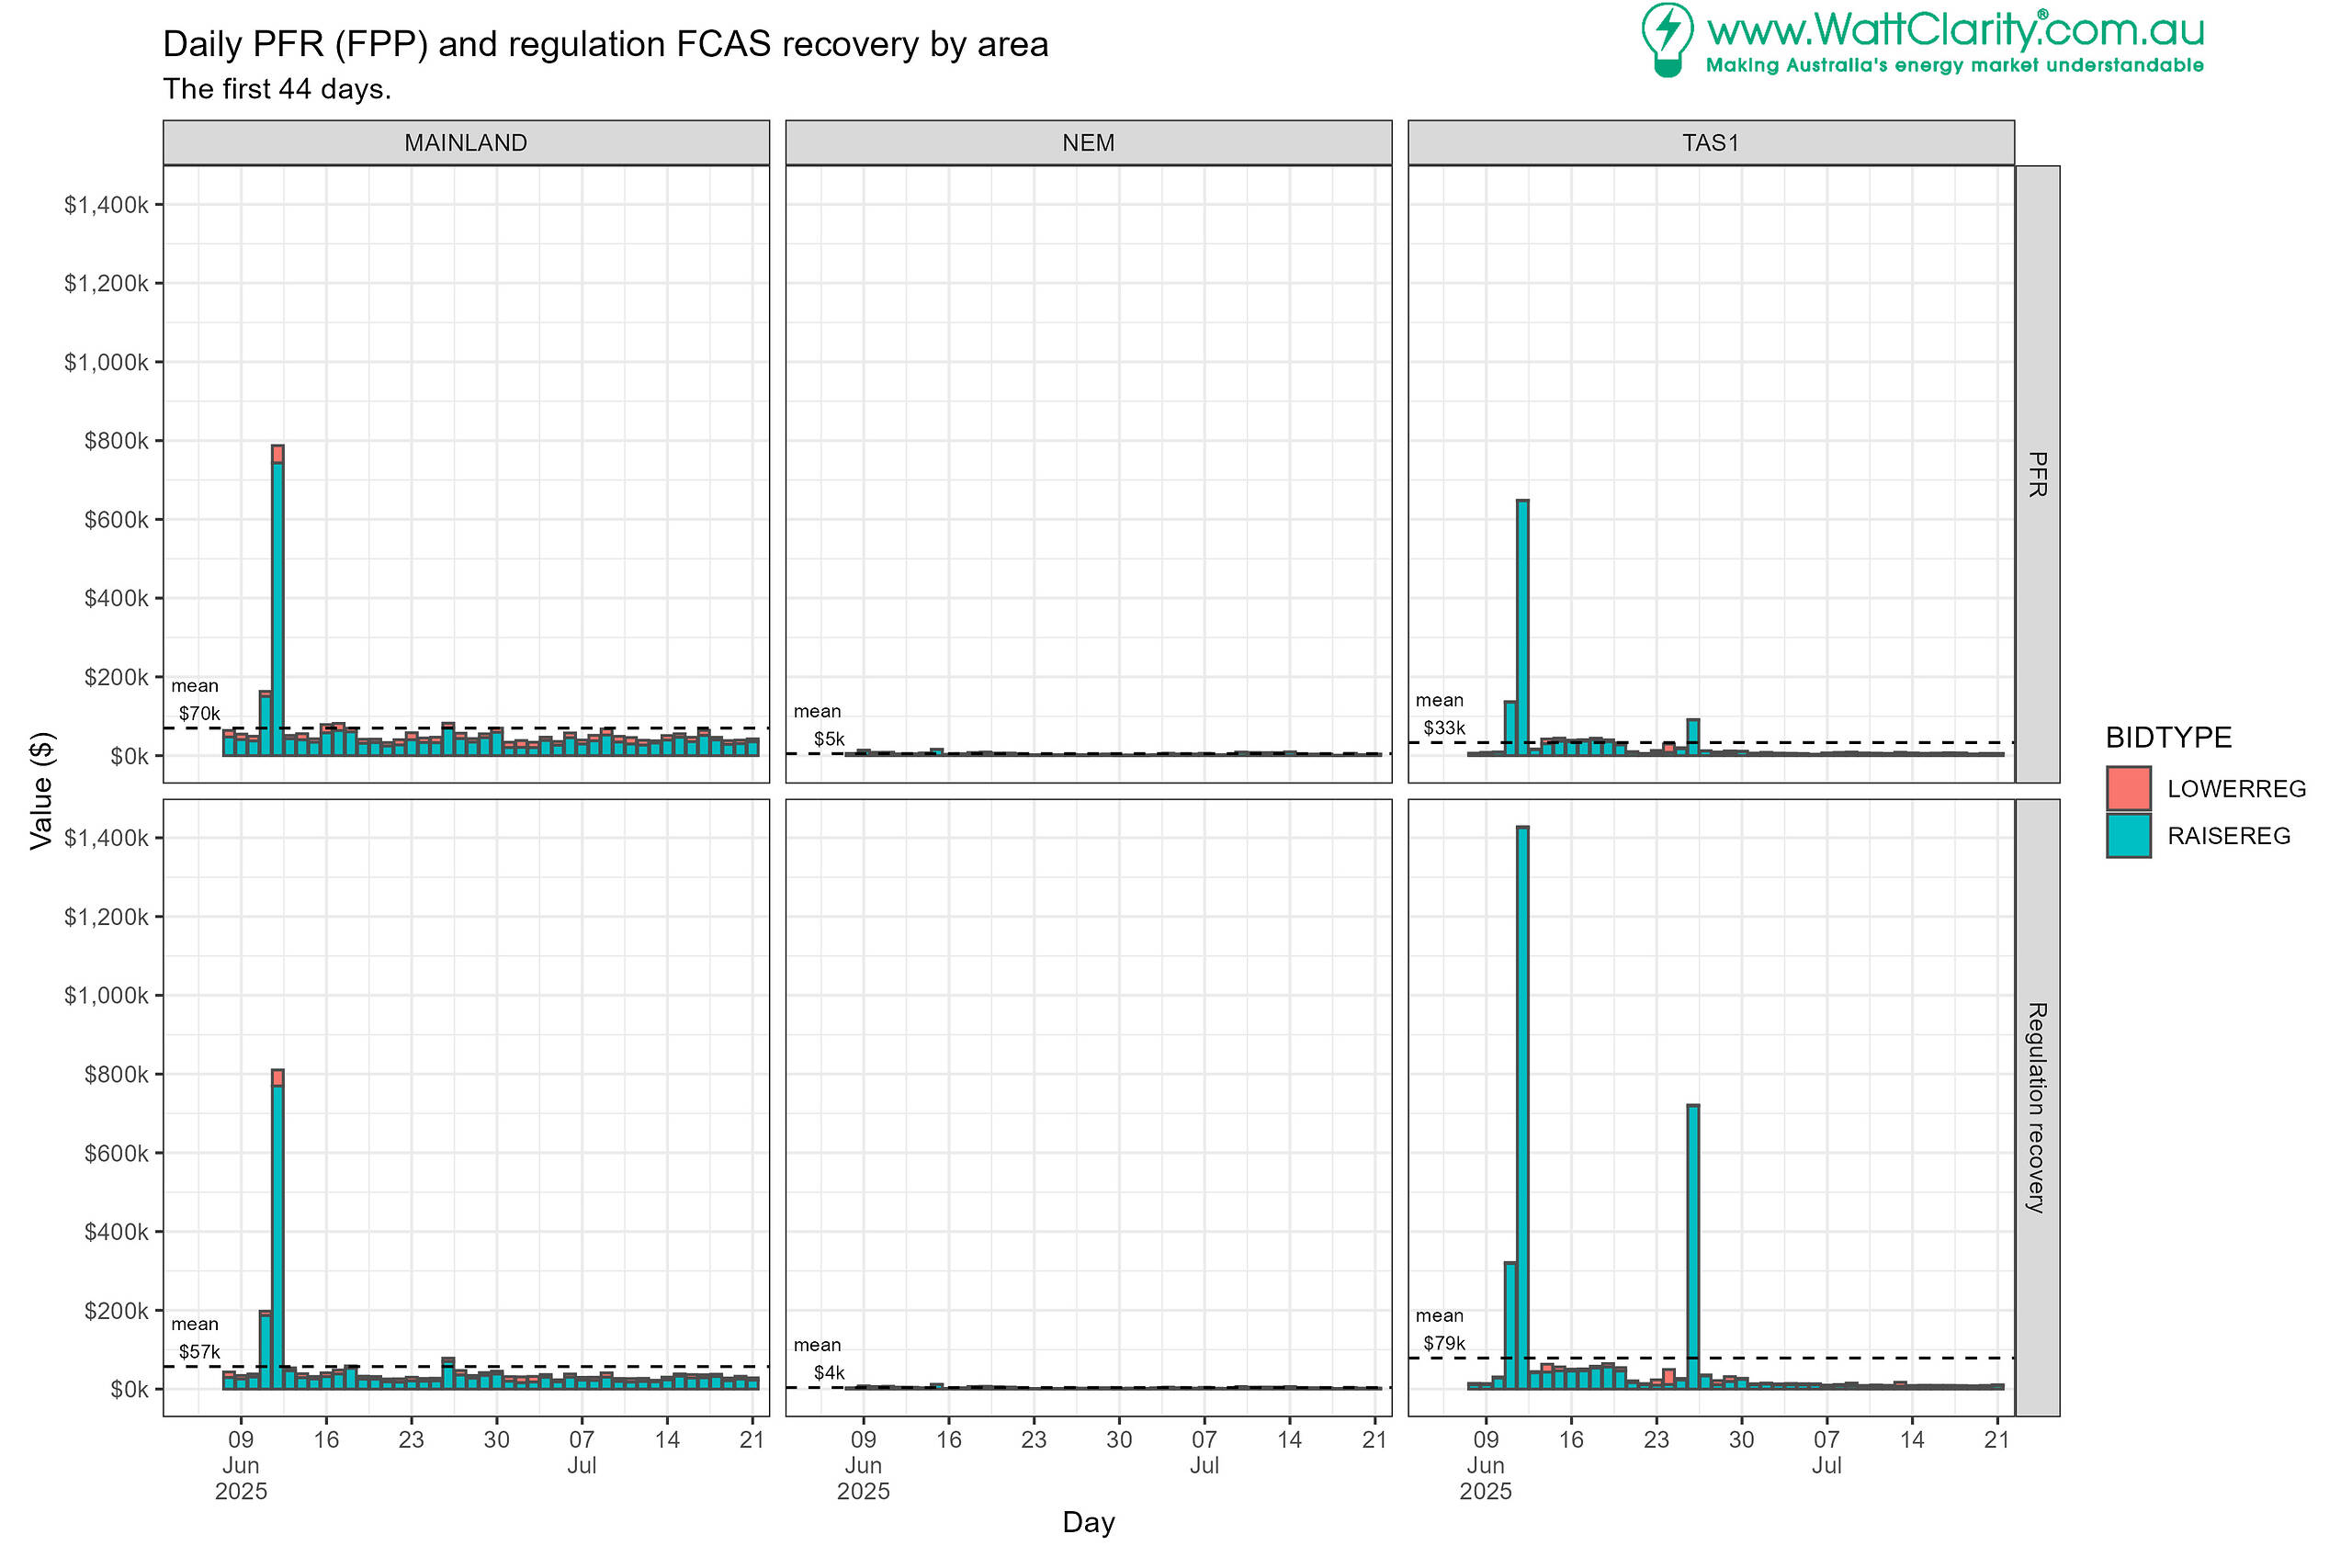
Perhaps one further reflection relates the potential for FPR costs to be greater than regulation recovery costs. Recall that the amount of MW for regulation response recovered is capped at the enabled amount whereas costs for PFR are based on the RCR (requirement for corrective response) and this can be higher than enabled regulation levels. In the chart above we see this play out on the mainland but not in TAS.
Default contribution factors play a material role
Costs for regulation FCAS that is used, each interval, are recovered in proportion to unit performance in the interval through ‘negative contribution factors’ (NCFs).
Costs for regulation FCAS that is not used are recovered in proportion to each unit’s historical performance – a default contribution factor (DCF).
In the next chart we see the used and unused proportions of the daily regulation recovery amounts.
The larger sizes of the bars filled in light blue indicate that costs for unused regulation FCAS have been greater than for used regulation FCAS for mainland and for TAS requirements.
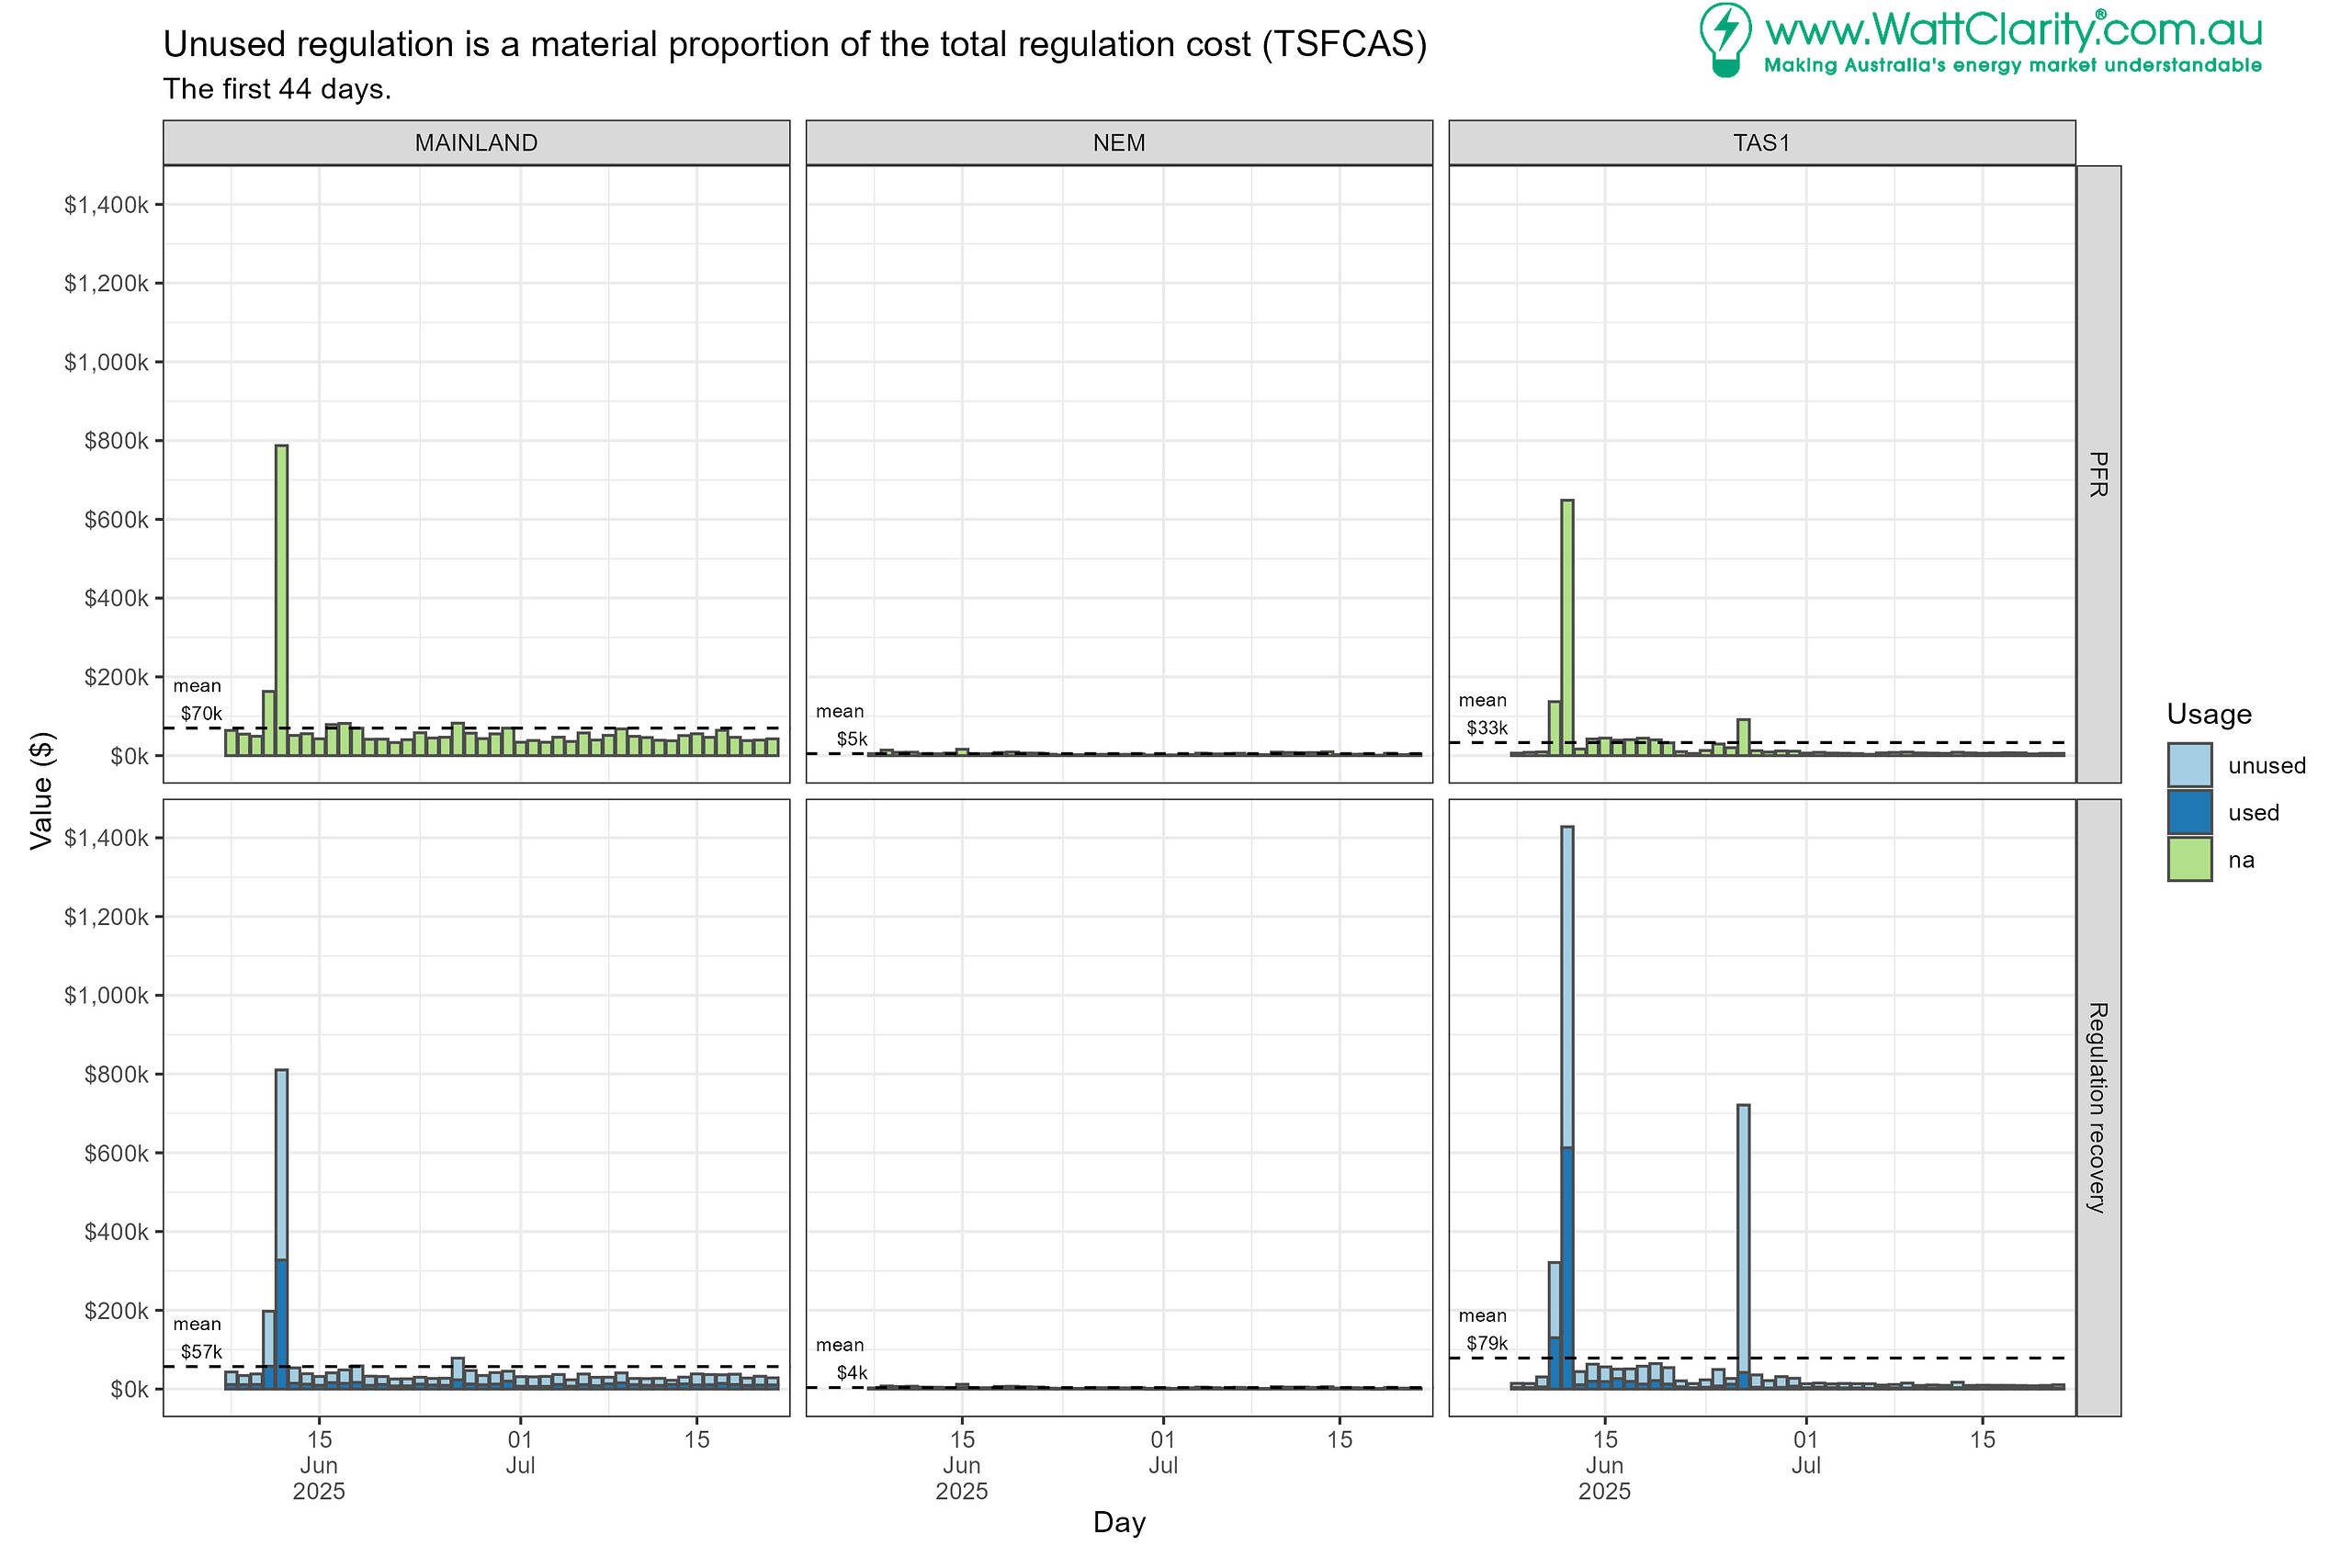
Usage is not applicable for FPR costs and payments.
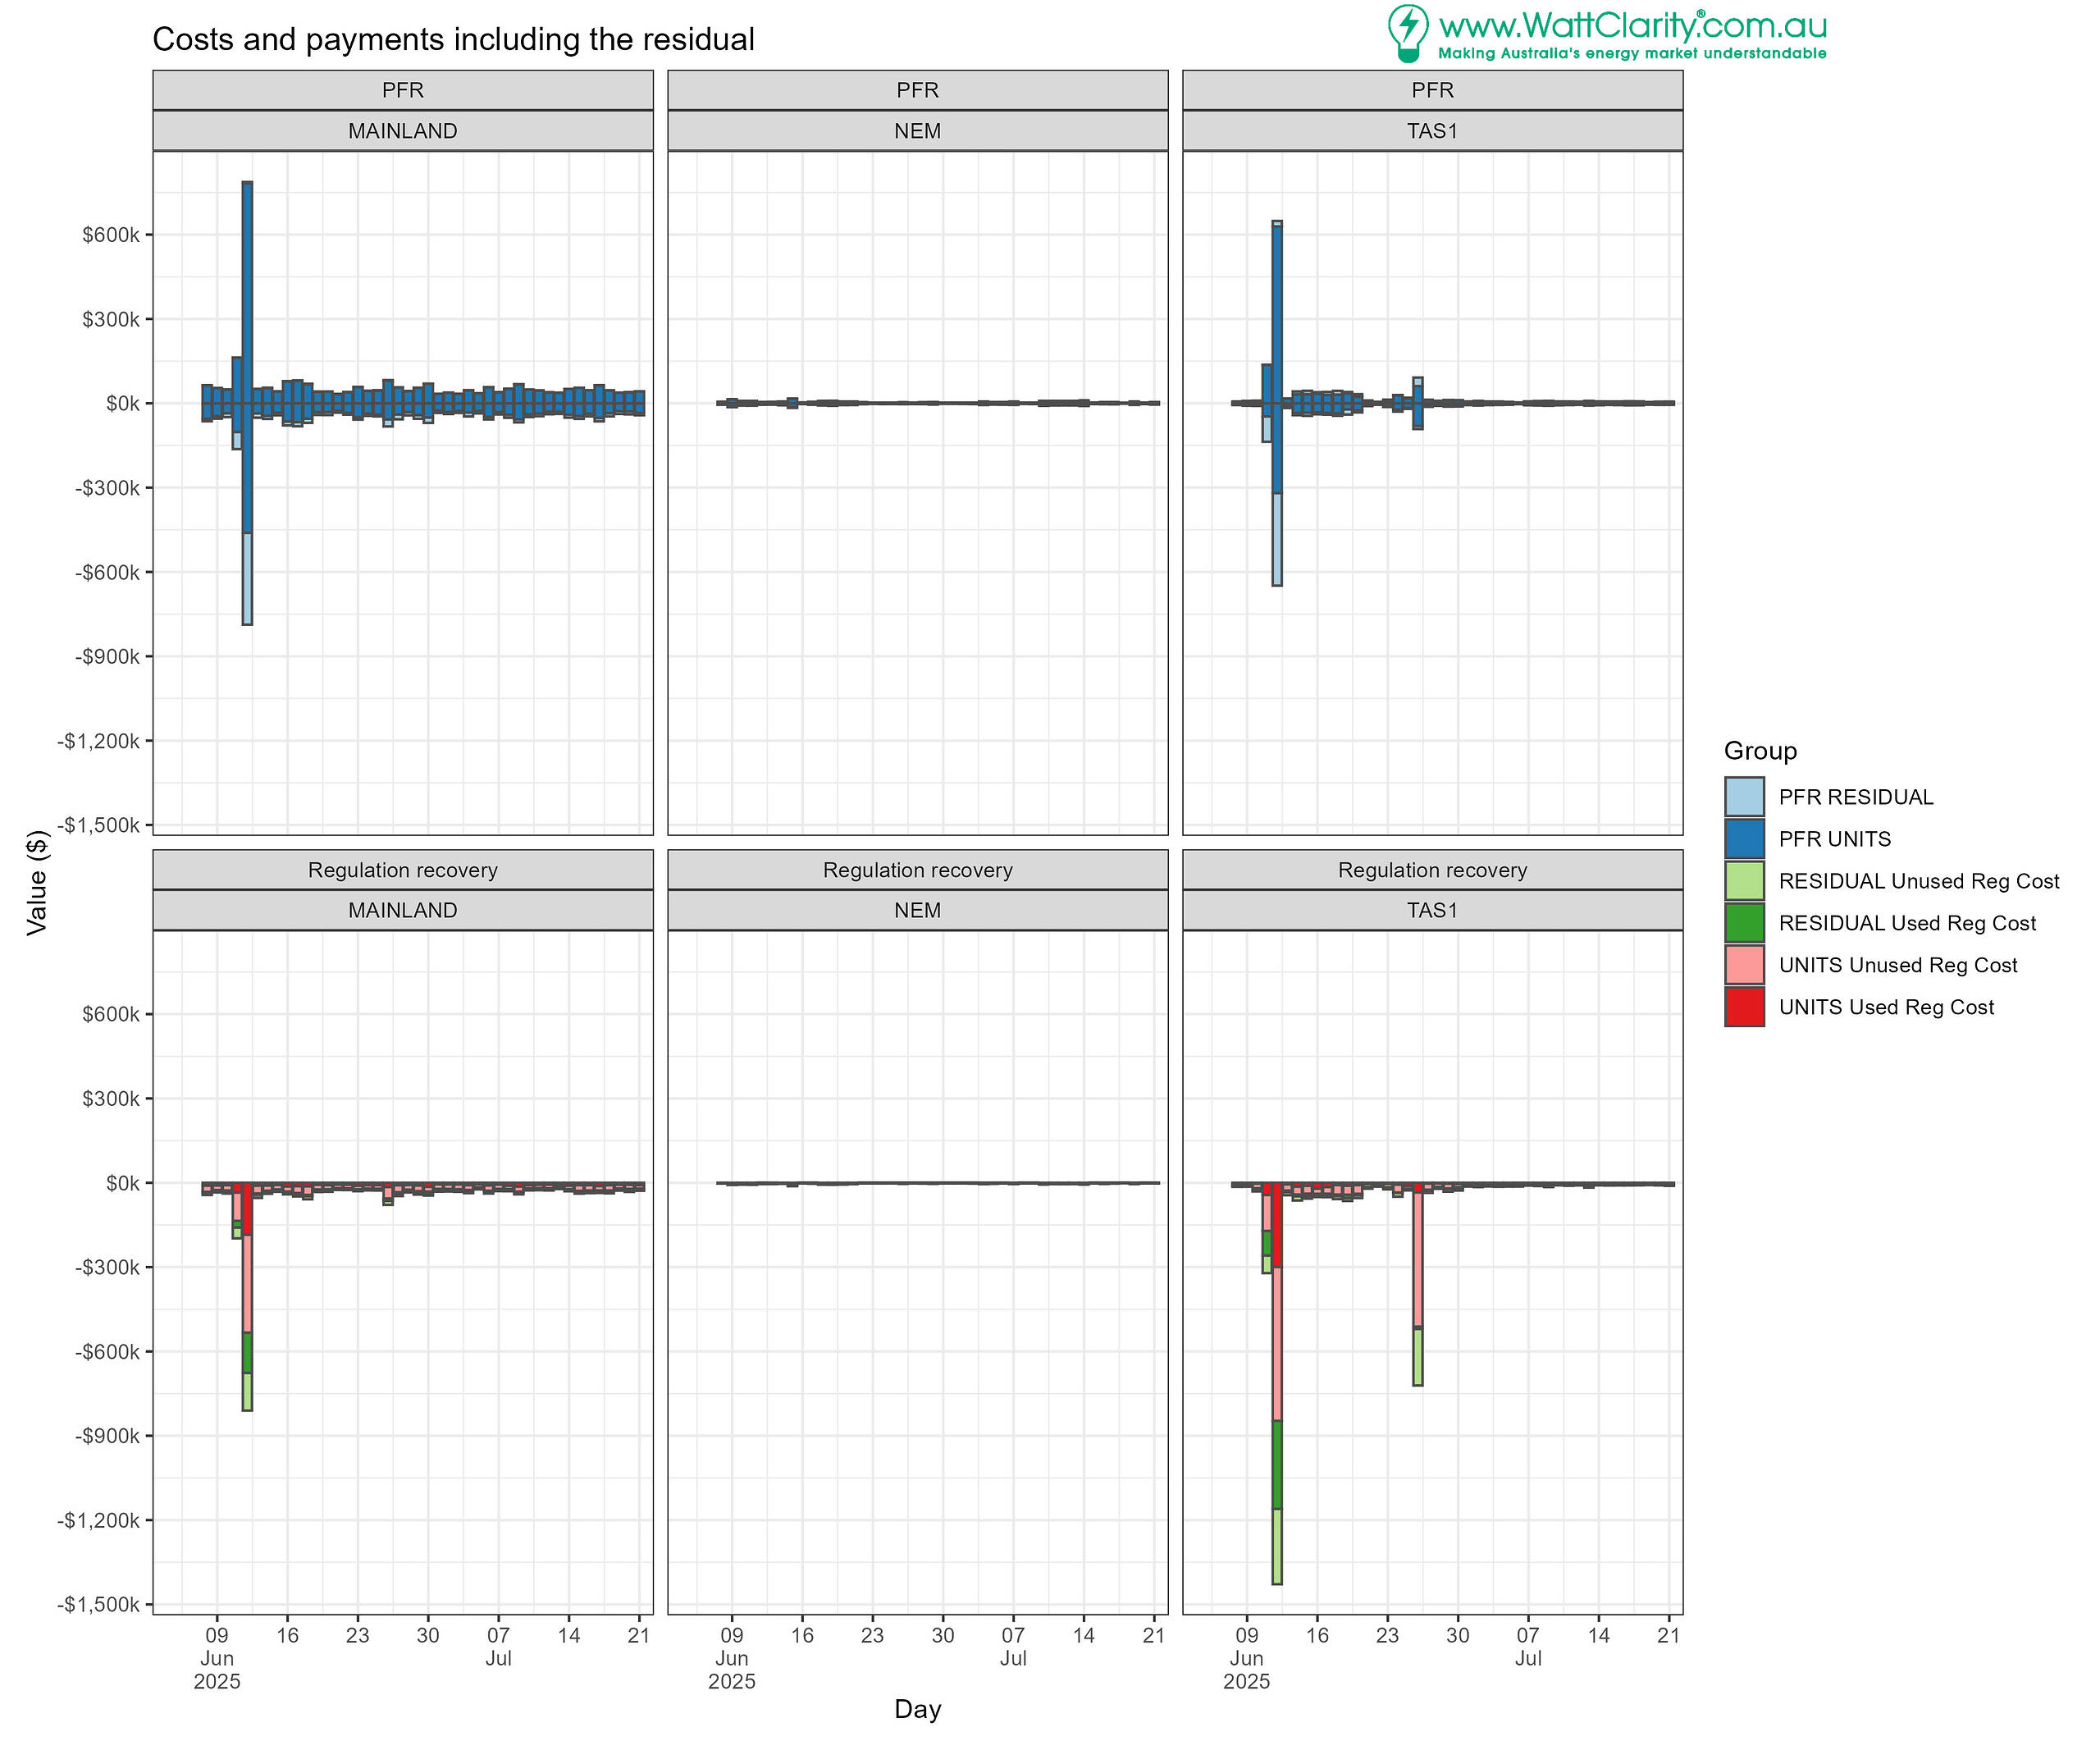
Separating the Residual
As noted in FPP winners and losers, the residual largely represents retail customers. This residual effectively makes up the difference between unit responses and the requirement in each direction.
Units with appropriate metering for individual FPP calculations (PFR and regulation) make up the ‘units’ category.
For the following chart, we’ve changed the sign of the ‘cost’ values to be negative so that PFR payments can be charted as positive. PFR is a zero-sum game; the unhelpful contributors fund payments to helpful contributors.
This helps to ascertain the performances of the units category relative to the residual.
For PFR we find:
- The residual appears as a relatively small component of daily costs, but is considerable on the extreme days and ‘net-negative’.
- Upon close inspection the residual appears as net positive on the 26th of June for TAS.
- Some units attract costs and some attract payments, as anticipated.
For regulation recovery we retain the used/unused segmentation and include a residual/units segmentation.
We observe costs allocated to the units category are greater than those allocated to the residual.
Analysis of the ‘units’ category at the technology-level and other groupings is yet to come.
So how much are the total costs for the system and how much are consumers paying for system stability in all types of FCAS and FPP payments