We noted earlier today that the ‘‘Lowest ever*’ point for ‘Market Demand’ in NSW crashes lower, on Sunday 16th February 2025’.
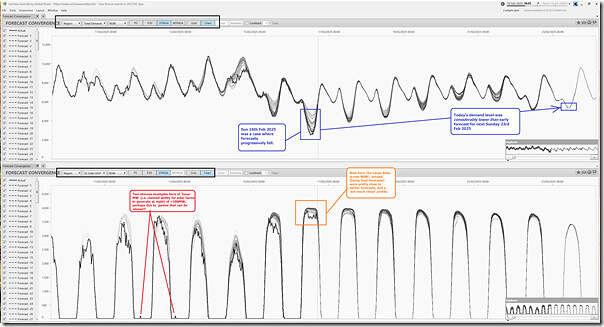
Curiosity drove me (a couple hours later – for the 16:35 dispatch interval NEM time) to take a look at how that low point compared to AEMO’s earlier P30 and ST PASA forecasts – which we can do easily via the ‘Forecast Convergence’ view in our ez2view software:
Most often, we use this widget with the ‘Grid’ view in order that one can ‘look up a vertical’ in order to ‘see that other dimension of time’.
But in this case the ‘Chart’ view provides better visibility:
1) At the top, looking at NSW ‘Market Demand’ we see that:
(a) The ‘actuals’ here for Sunday 16th February 2025:
i. Are well below AEMO’s earlier forecasts
ii. we can clearly see AEMO’s successive forecasts being progressively ratcheted down, though still not far enough
(b) But are also ~3,000MW below the AEMO’s earliest forecasts for the level of ‘Market Demand’ next Sunday, 23rd February 2025
(c) Are, likewise, considerably below any other day in the ~2 day horizon.
2) At the bottom we show the aggregate UIGF for all Large Solar Farms across NSW
(a) Noting that this widget has not yet been enhanced to show AEMO’s successive forecasts for rooftop PV, we thought this was a useful surrogate to illustrate
(b) We see that the ‘actuals’ for Sunday 16th February 2025:
i. which in this case are the last forecasts used in dispatch for the 5 minute periods in each half hour (so as not to confuse the issue with curtailment)
ii. show a shape that might be thought of ‘almost no cloud cover’, and also quite close to earlier forecasts.
iii. which reinforces the assumption that rooftop PV has driven the ‘Market Demand’ down further (from an already suppressed level of ‘Underlying Demand’ due to low airconditioning use).
(c) As an aside we also see two instances of ‘lunar megawatts’ from one or more Large Solar Farms:
i. Of ~100MW magnitude (i.e. not insignificant)
ii. At 23:00 on 11th February 2025 and 21:30 on 12th February 2025
iii. Which we have not trailed back to particular solar farms but which we’re assuming can be another example filed under ‘games that can be played with self-forecasts’.


Be the first to comment on "New lowest-ever* point for NSW ‘Market Demand’ on Sunday 16th Feb 2025 was lower than AEMO’s earlier forecasts"