Opted for a shorter walking route home today because of the Brisbane weather noted earlier.
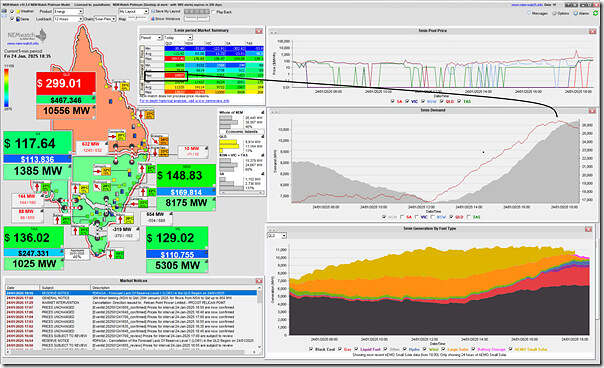
Arriving home we’ve checked with NEMwatch in this snapshot for the 18:35 dispatch interval (NEM time) on Friday 24th January 2025 and we see that the ‘Market Demand’ reached 10,897MW (target for the 17:45 dispatch interval):
So a quick scan using the ‘Trends Engine’ in ez2view (not shown here) reveals that that level of demand has only been exceeded previously on two other days:
1) On 22nd January 2024, where the ‘Market Demand’ peaked at 11,036MW; and
2) Two days ago, on Wednesday 22nd January 2025, where ‘Market demand’ peaked at 11,159MW.
So pretty high today, but no cigar.


Hi Paul, in reporting the peak loading, you need to factor in the administrative load curtailment in effect (which has an associated economic loss) in order to obtain fair comparison of events. Over-loading the grid is one thing, having to shut down the economy is quite another cost!
I must be out of touch as I have never seen QLD demand (10,897MW) exceed NSW demand (~8,175MW) by 2,722MW.
It would be interestung to see a monthly peak demand comparison between these 2 NEM regions over the past few years.