I was speaking with a client only ~90 minutes ago and noted that the AEMO was forecasting a run of volatility this evening in NSW … in part because of the planned outage of Marulan-Yass 330kV line (Transgrid Line 5):
1) that Allan noted in his comment here;
2) represented in the EMMS via the‘N-MNYS_5_WG_CLOSE’ constraint set’
3) and which has manifest before in the binding of the ‘N::N_MNYS_2’ constraint equation.
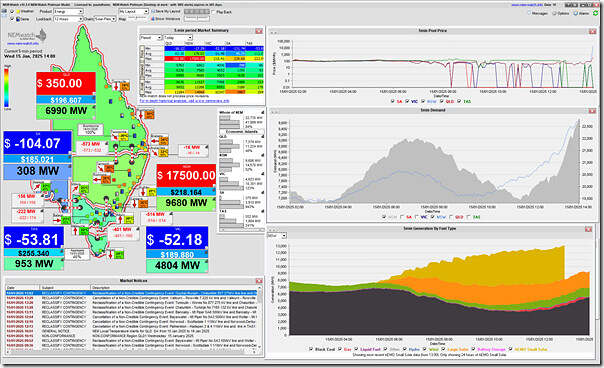
Well, at 14:00 (NEM time) we see in this snapshot from NEMwatch that the volatility has commenced earlier than expected:
… so our suspicions were aroused about the network outage we’d discussed with that client so recently.
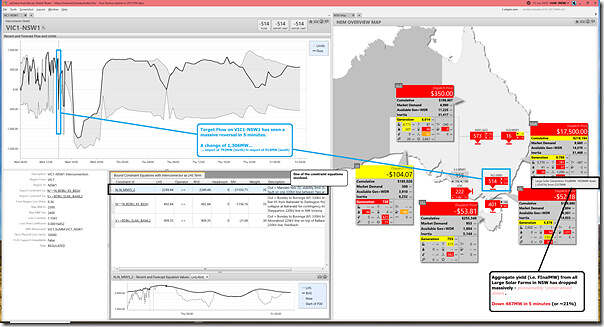
Keen to explore a bit more (but with limited time) we take a quick look at this collage of ez2view widgets, time travelled back a few minutes now to 14:00 (which also shifts the basis for the ‘NEM Map’ widget from InitialMW to FinalMW):
Briefly…
1) We see that there’s been a large reversal in flow on the VIC1-NSW1 interconnector:
(a) From an export (i.e. north from VIC) of 792MW to an import (i.e. south into VIC) of 592MW
(b) Which represents a 1,300MW change in 5 minutes
(c) Which puts an increased demand on supply options in NSW and QLD
2) With respect to the interconnector, we see (at 14:00 NEM time) that there are three constraint equations bound:
(a) Firstly, we see that the ‘N::N_MNYS_2’ constraint equation is indeed bound
i. And with a large Marginal Value ($-21,103.71/MWh)
ii. Offline we see that this constraint was not bound at 13:55
(b) We also see that the ‘N^^N_BDBU_X5_BESH’ constraint equation is bound
… this is one part of the disassembled ‘X5’ constraint.
(c) We also see that the ‘V>>BDBU_ELML_BAML2’ constraint equation is bound.
… which we’ve written about once before (at present count).
3) In addition to the reversal of flow on the interconnector (and presumably in large part because of the effect of the constraints?) we also see that solar yield in NSW has dropped significantly.
4) Not noted explicitly on the image, but we can also see FinalMW from NSW hydro units is up by ~690MW.
So, even at a high level, we see that the increased demand for supply from units in NSW+QLD combined with the reduced supply from solar in NSW (offset by the increased supply from hydro in NSW … but not by enough surplus to make up for the reversal on the flows) drives the NSW price high.
More would be visible tomorrow … with ‘next day public’ data.


The underlying cause looks like a sudden drop in northern NSW large solar output, particularly at New England Solar Farm – a “system strength” constraint out of nowhere dropped its output target from ~370 MW to zero at 1400. The N::N_MNYS_2 constraint also played a role because the only NSW generator that could ramp quickly enough to cover the drop – Tumut 3 – sits on the wrong side of that constraint. I half suspect a rogue input to the system strength constraint could be the real issue.
Some further digging shows the system strength constraint came on because of a forced outage / trip of a transformer at Muswellbrook in northern NSW that took some QNI-related lines out of service – that’s the fundamental villain of the piece.
Thanks Allan, have noted more in the article ‘About the ‘N_NEWENSF1+2_100-INV’ constraint equation that violates at 14:00 on Wednesday 15th January 2025 – Part 4’ here.
Hi Allan & Paul, thanks for the commentary. I’ve seen this happen before when TUMUT3 ramping upwards causes the NSW interconnector to flip 180 degrees (once was a couple days ago, once on 21/11/24). As touched on by you Allan, I think because TUMUT3 as a large positive term on the LHS of N::N_MNYS_2, N::N_2_5_2 (among others), when it ramps up, NEMDE seems to choose to flip the interconnector (force it’s target flow negative), as opposed to constraining other generators on the LHS? It seems unusual to me but intuitively, given the congestion around Marulan-Yass, energy from TUMUT3 has nowehere else to go but southwards. To make things even more confusing, the price setter for 14:05 shows TUMUT3 price setting with their -$1000 bid… but for an increase in -139MW. What is the price setter file implying here? that to meet a marginal increase in demand, the marginal cost arises from the cost of TUMUT3 turning off? Thanks guys