Yesterday evening we posted briefly about ‘(Almost completely) out of the blue, an Actual LOR2 … in NSW on Monday 13th January 2025’ with respect to the short-notice ‘Actual LOR2’ condition for NSW on Monday 13th January 2025.
… in that article we used a snapshot from NEMwatch to highlighted that the VIC1-NSW1 interconnector was constrained in both directions, such that it could not export or import. From the perspective of the short-lived tight supply-and-demand balance in NSW, it’s the constrained exports (i.e. flow from VIC to NSW) that are of most interest.
Worth following up briefly with two snapshots from ez2view to illustrate more:
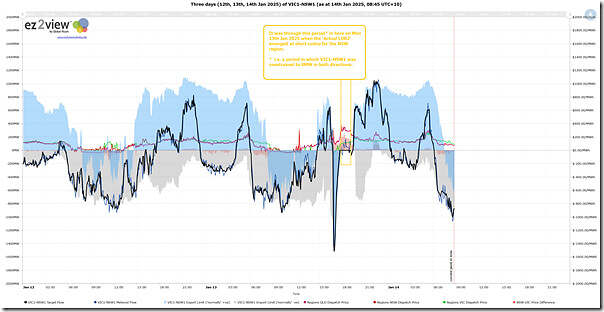
Firstly, above, we use the ‘Trends Engine’ in ez2view to access this previously prepared trend of various parameters related to the VIC1-NSW1 interconnector, with the time-span of constrained flow highlighted … within which also happened to be the ‘Actual LOR2’ (not just coincidence).
… those with a licence to the software can open their own copy of this query here.
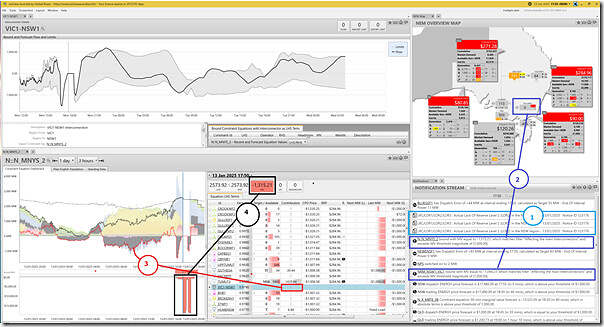
Following from this, below, we show a snapshot of a collage of widgets in ez2view at the 17:50 dispatch interval (NEM time):
We’ve added 4 annotations as follows:
1) This was the 5-minute dispatch interval within which (i.e. at 17:49:35) Market Notice 123176 (which we noted earlier) was published, notifying the market of an ‘Actual LOR2’ condition.
2) In this dispatch interval we see that the VIC1-NSW1 interconnector is bound in both directions … with:
(a) The ‘N::N_MNYS_2’ constraint equation is bound, limiting the export limit to 0MW.
… note that we have seen this one before, given it’s one of the ones affecting the 330kV lines connecting southern NSW to Sydney.
(b) The ‘NRM_NSW1_VIC1’ constraint equation (i.e. for negative residue management) is limiting the import limit to 0MW.
3) We see, in the red line on the ‘Constraint Dashboard’ widget for the ‘N::N_MNYS_2’ constraint equation, the trended contribution (to the LHS) of the VIC1-NSW1 interconnector:
(a) Note that the contribution is measured as the Factor x Target
… in this case the factor is 0.9790 for the VIC1-NSW1 interconnector.
(b) We see that, to that point, the contribution had mostly been negative (i.e. increased flow south allows more room for generators in southern NSW to produce, capturing the prices available at the RRN despite the 330kV limitations in southern NSW).
(c) Hence, conversely, when VIC1-NSW1 is unable to flow south (due to negative residues built up), there’s less headroom available for generators in southern NSW, so more of them are also ‘constrained down’.
4) Finally, we see that the Marginal Value of the constraint has spiked … to –$1,315.21/MWh
… don’t have time to go into the gory details of the number sign, it’s the absolute magnitude that’s most important in the first instance.
So that’s where we will leave this ‘Part 2’ of a Case Study.


Two additional important points on this:
– the constraint is invoked because of a pre-existing planned outage of Marulan-Yass 330kV line (Transgrid Line 5), scheduled to run over 11-19 Jan. This is the same outage that led to some very high prices in NSW and Qld in early November 2024.
– when the NRM constraint clamps NSW -> Vic flows to zero, it’s true that this forces down generation in southern NSW. However this doesn’t reduce net supply to meet demand in NSW, because any higher generation in southern NSW would simply flow south into Victoria – there is a hard restriction on flows from southern NSW towards Sydney because of the Line 5 outage.