Another short article on Monday 16th December 2024* to note that the NEM-wide demand did peak at 33,674MW in the 17:30 dispatch interval (NEM time), when measured as ‘Market Demand’.
*… and noting that Dan Lee has also posted a similar note a couple minutes earlier here (but retaining this one also, for added context)
… this correlates quite well with the AEMO forecast in ST PASA early on Friday afternoon last week:
(a) when we wrote that ‘NEM-wide demand on Monday 16th December forecast to be highest in almost 4 years’.
(b) at that time the forecast was that it would be 33,718MW in the half-hour ending 18:00 (NEM time),
(c) so only 44MW lower, and 30 minutes earlier, than forecasts 3 days prior!
… take a bow, AEMO operational forecasting!
(d) Of course that also still means NEM-wide ‘Market Demand’ was actually highest since 31st January 2020 (a very stressful day in the NEM).
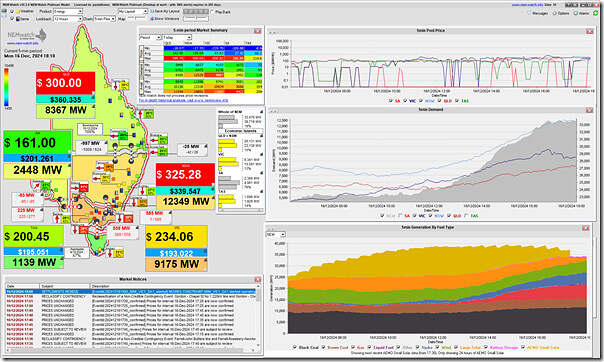
Here’s a snapshot from NEMwatch at the 18:10 dispatch interval (NEM time), when the NEM-wide ‘Market Demand’ was at 33,478MW:
From this we can make a number of other observations:
1) Both NSW and VIC region demand are elevated out of the ‘green zone’ (i.e. mid-range compared to historical range) … but neither are sky-high.
2) With respect to IRPM for some ‘Economic Islands’ we see alerts in the yellow colour range (indicating some moderately tight supply-demand situations).
3) But still price largely behaved themselves through the evening
4) Is that because of a combination of factors, including:
(a) interconnector limitations also behaved themselves and were not as severe as they have been on other occasions?
(b) the UIGF of 5,439MW of wind power (and 2,499MW at 17:30 of Large Solar) definitely helped to drop price down the bid stack.
(c) plus more, no doubt…
Earlier this afternoon we wrote about how ‘NEM-wide ‘Market Demand’ is trending above forecast (to 15:45) – in part because of …’ (and Allan helpfully clarified here).
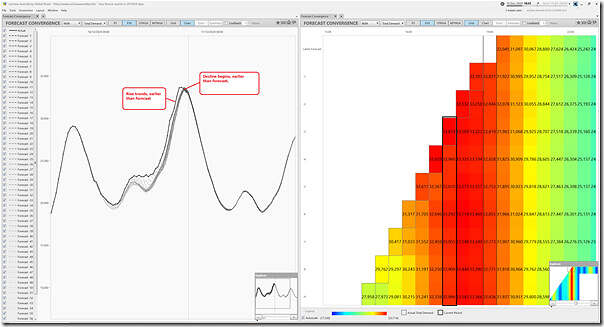
To follow that snapshot from within ez2view, here’s a subsequent view of two different ‘Forecast Convergence’ widgets, both focused on NEM-wide ‘Market Demand’ to 18:MM – on the left the chart and on the right the grid:
We can see that NEM-wide ‘Market Demand’ continued to climb earlier than forecast … but we see it also declined earlier than forecast as well. At some point in future we might look at that in more detail (but not now).


As an (irrelevant to the topic) side bar, the pronounced saw tooth profile of the AEMO small scale solar is interesting. Any idea what gives rise to this? Given these are <100KW and the sun rises continuously, one might expect a smooth profile.
It’s just an artefact. The solar data is a half-hourly estimate. When superimposed on generation data with 5 minute granularity, the sawtooth pattern results.