We’ve been keeping a close watch on NEM mainland grid frequency lately, using the data from Global-Roam’s high speed frequency monitor located in Brisbane.
And we’ve been spurred by a number of questions and comments to look back at historical frequency patterns, including one (via LinkedIn) related to Paul’s article NEM Mainland Frequency drops below the NOFB, on Tuesday 12th November 2024 .
It’s not the first time we’ve done this at WattClarity. For example we reported on the patterns in 2021. That analysis, and more, can be found at the Trend of Frequency Performance page.
In this overview standing at the tail end of 2024, we take an updated longitudinal look-back at how frequency has changed over the years.
In doing so, we aim to obtain a good overview of mainland frequency extents and typical ranges, helpful to contextualise any follow-on investigations into NEM frequency.
Narrow, then wide, now narrow
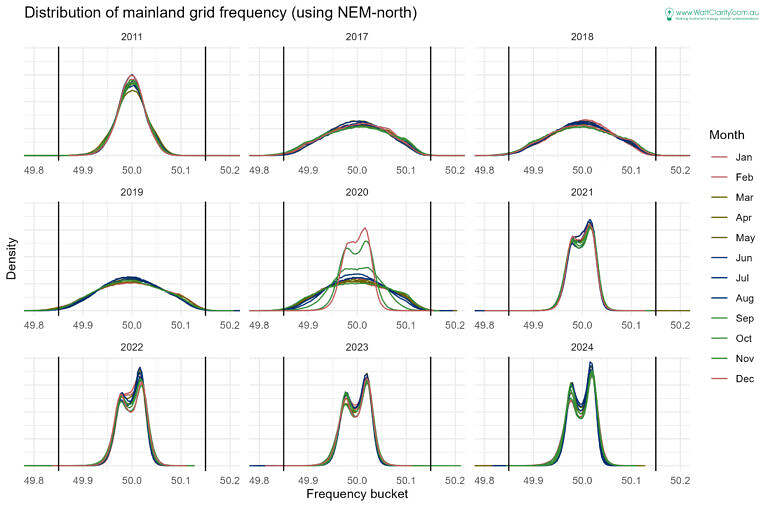
Using the 4-second data we’ve processed frequency in 2011, and from 2017 to 2024 (year -to-date). The following chart summarises the frequency in those years by month as a density plot (number of measurements in a bucket divided by total number of measurements).
Narrow
In 2011 we can see the frequency distribution was tight, typically well within 49.9 and 50.1 Hz.
Wide
By the time 2017 came about that tight distribution of mainland frequency had slipped. Relative to 2011, many more 4-second readings were outside the 49.9 to 50.1 range (not seen in 2011) and even outside the normal operating frequency band (NOFB) of 49.85 to 50.15 (represented by the vertical lines on the chart below).
Back in 2017 Kate Summers highlighted the regulatory settings that were driving this slippage in Fast Frequency Service – Treating the symptom not the cause?
Narrow
It wasn’t until November and December of 2020 that the frequency distribution showed signs of a tighter domain around 50 Hz. This is attributed to the introduction of mandatory primary frequency response.
Since 2021 the tighter distribution has persisted.
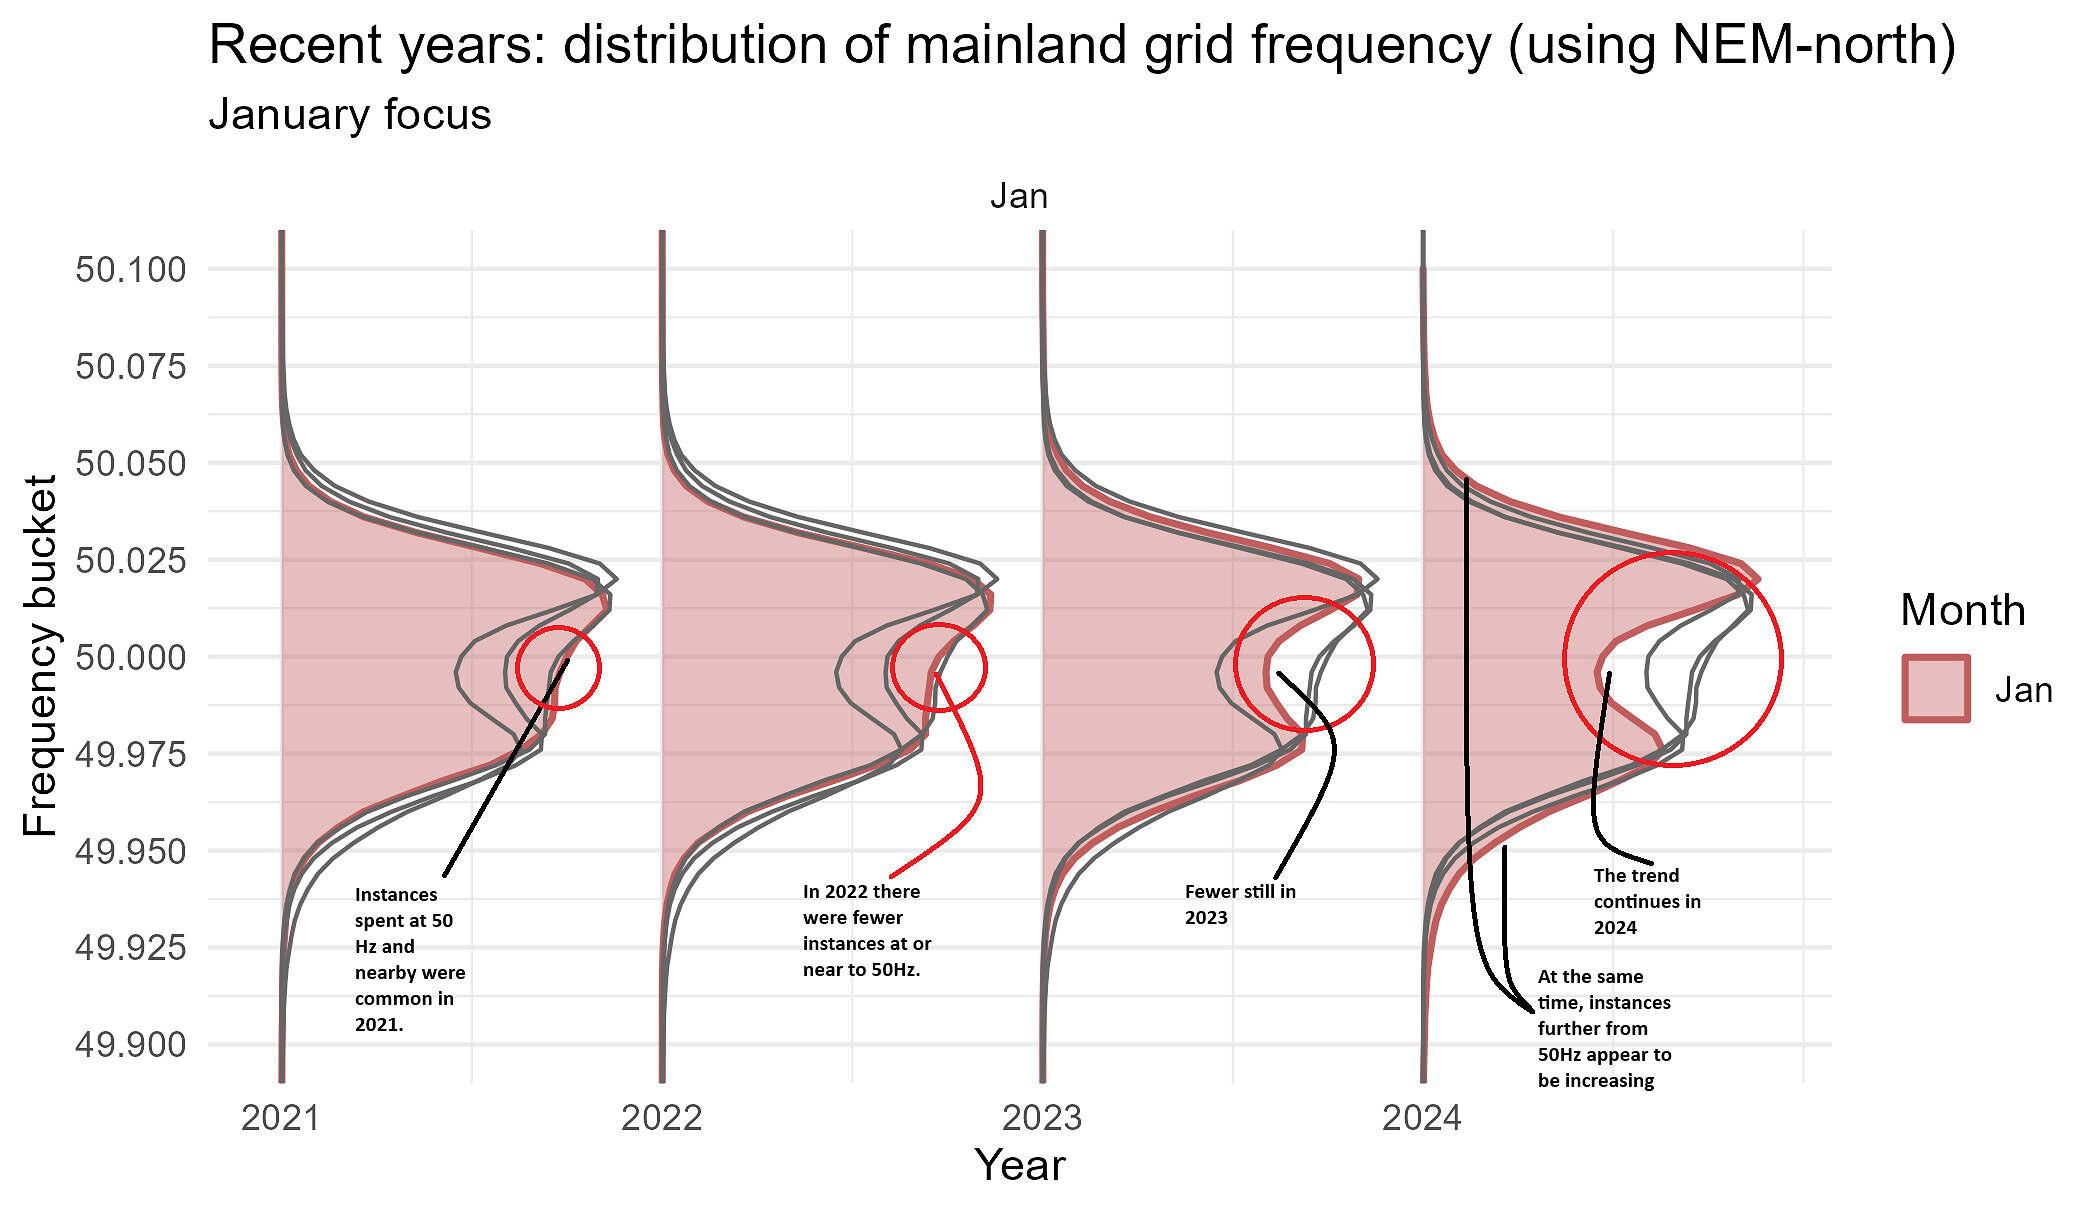
However, the distributions aren’t quite the same as we uncovered the 2011 data. There’s a dip about 50Hz that was not present in 2011.
*Note that distributions for January 2020 and October – December 2019 are omitted due to data quality.
Less time spent at 50
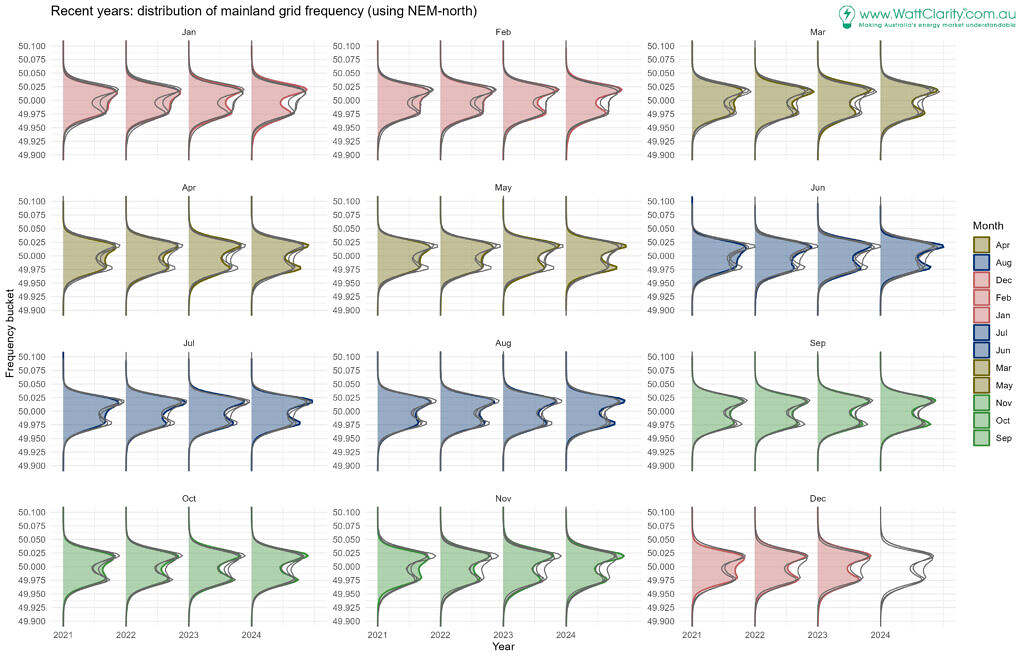
The next two charts take the monthly distributions and plot them individually, year-by-year.
- These distributions (for the highlighted month and year) are coloured by season.
- Additionally, grey lines for the other years are drawn to help compare.
But before we get to the chart, let’s go over a sample, the Januarys, to highlight some patterns that are emerging.

We see the patterns of the January months are evident in the other months in the chart below. However, a weaker signal appears to be evident in the winter months.
At the extremities
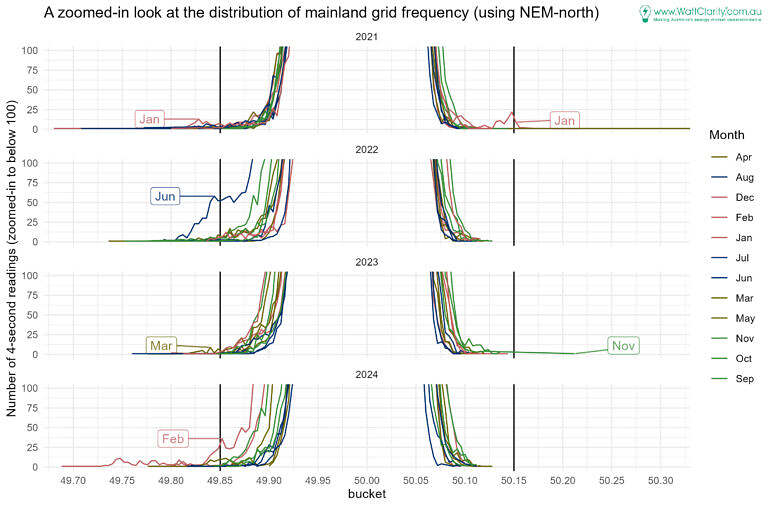
When we cut out the incidences at typical frequencies, performance at the extremes becomes more visible. The distributions of the first chart (above, top) are clipped, producing the chart below.
For this chart, note the y-axis is the count rather than the density.
In all years charted we see instances of frequency below the lower end of the normal band
-
- Events in recent memory include the the significant power system event on the 13th of February, 2024, driving that month’s performance.
- Yet recalling the distributions of 2017 to 2020 nowadays grid frequency remains in a much better place comparatively.
There is a skew to lower frequencies
-
- One reason for this, that may lead to further analysis, is the role and prevalence of semi-dispatch caps on semi-scheduled units – when these caps are in force affected units are permitted to deviate below their energy target and not above it. Therefore, there will be a tendency for under supply of energy when semi-dispatch caps are on (associated with inaccuracies in dispatch availability forecasts), leading to a drag on frequency. As more and more VRE comes into the NEM this effect has the potential to play a greater role in the future.
There is more to uncover in the outliers when frequency is outside the NOFB, as well as trends of frequency within the NOFB. And let’s not to forget Tasmanian frequency performance. We’ll aim to delve into these aspects in the future.


Leave a comment