
On October 16th, several powerful supercells tore across western Victoria and New South Wales, leaving a trail of damage in their wake. Among the most severe impacts were the failures of multiple transmission towers due to intense winds south of Broken Hill, which resulted in significant power outages across the region.
Tracking the Supercells with Weatherwatch’s Storm Intensity Map
One of the key tools we used to analyse these supercells was Weatherwatch’s new Storm Intensity Map. This map provided a clear visualisation of the storm paths, showing where the two supercells tracked south of Broken Hill and how they intersected with the high-voltage transmission powerlines. The insight offered by this tool is invaluable, particularly when assessing areas of impact and potential damage.
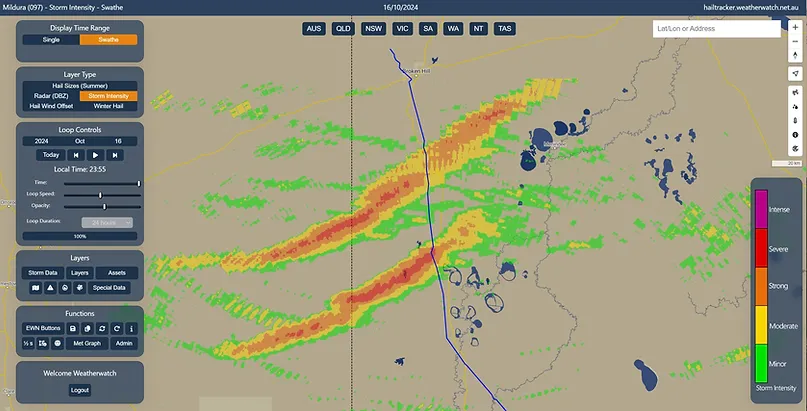
Storm Intensity Map shows the path of two supercells in southwestern NSW on October 16, 2024. Source: Weatherwatch
What stood out in this analysis was not only the path of the storms but the sheer intensity they exhibited—even at a considerable distance from the radar. Typically, radar accuracy diminishes the further away the storm is due to the curvature of the Earth, which limits the radar’s ability to scan the full structure of the storm. Additionally, the radar beam widens at longer distances, leading to a lower resolution of the storm’s intensity. Despite these limitations, the supercells south of Broken Hill displayed strong signatures of severity.
An Unlikely Thermodynamic Environment
Equally fascinating was the atmospheric environment in which these storms developed. While the kinematic environment (wind shear) was highly supportive of supercell formation, the thermodynamic environment (instability) was notably weak.
Surface-level instability indicators were unimpressive, with Convective Available Potential Energy (CAPE) values barely above 0 j/kg and Lifted Index readings hovering around +2. Both of these figures typically suggest a stable atmosphere, which would generally not support the formation of such powerful storms. However, the situation appeared different at the mid-levels of the atmosphere.
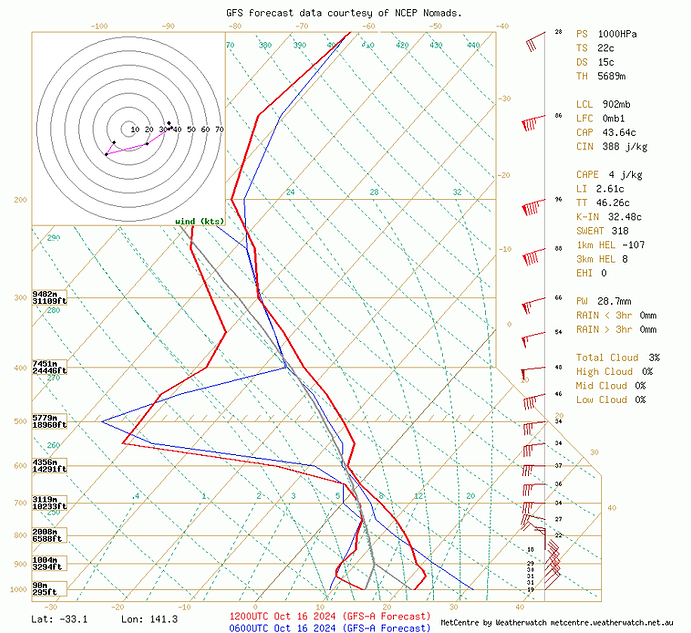
GFS analysis sounding for SW NSW on October 16, 2024. Note the strong NE winds in the lower atmosphere, backing to the west above 1km in height. Further, there is mid-level moisture which likely initiated storm activity. Source: Weatherwatch MetCentre
The sounding data pointed to a moist boundary layer between 600 and 700 mb, a favourable zone for storm development. Although there was evidence of a warming atmosphere above this layer, we suspect the readings were distorted by earlier convection. If we assume that the mid to upper atmosphere was actually 1-2°C cooler than indicated, the Lifted Index would likely approach 0, with a few hundred CAPE—still not ideal for major storm development but enough to allow for some storm activity.
The Critical Role of Wind Shear
The real driving force behind these long-lived supercells, however, was the wind shear. As we often say at Weatherwatch, “it’s all about the wind shear,” and this event was a textbook example. Even with minimal instability, the wind dynamics were more than capable of sustaining severe thunderstorms.
At the lower levels of the atmosphere, winds within the bottom 1 km were out of the northeast at 20-30 knots, turning westward at 35-40 knots aloft. This provided excellent turning in the lower atmosphere, producing high levels of bulk shear (50-55 knots)—well beyond the threshold needed for supercell development. This kind of wind profile creates the ideal environment for storms to rotate and remain organised over long distances and periods of time.
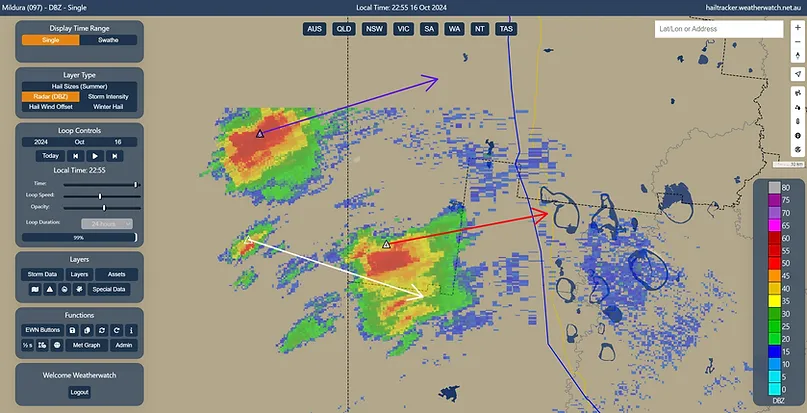
Radar imagery with storm intensity markers & storm direction, suggesting potentially destructive conditions in the northern storm. Source: Weatherwatch
Tornado Potential: Was it Wind or a Twister?
Reports of a tornado causing the damage in Broken Hill have surfaced, though without an official damage survey, it’s difficult to say for sure whether one occurred. The storm appeared to primarily rely on mid-level instability, which suggests that a tornado would be less likely. Furthermore, the presence of dry air at lower levels supports the idea that the damaging winds were more likely caused by strong straight-line winds rather than tornadic activity. That said, until more detailed assessments are completed, we can’t entirely rule out the possibility of a tornado.
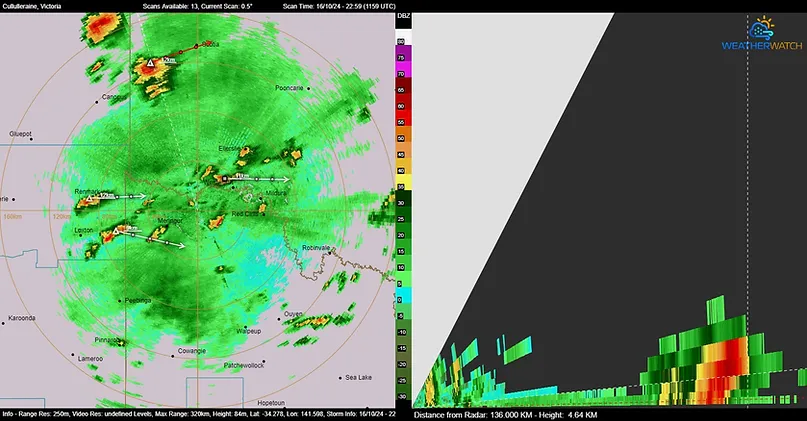
3D radar slice of the southern storm showing a Weak Echo Region (WER) on the northern side of the storm which is a sign of intensity Source: Weatherwatch MetCentre
This event serves as a powerful reminder of the complexity of severe storm development. While most people focus on instability as the primary driver of thunderstorms, this analysis shows that wind shear can sometimes take centre stage. Weatherwatch’s tools, such as the Storm Intensity Map, allow us to monitor and assess these severe storms in real-time, helping businesses and communities prepare for potential impacts.
As we continue to refine our forecasting technologies, we remain committed to providing our clients with the most accurate and actionable weather intelligence possible. If you need assistance in tracking severe storms, issuing alerts of help with damage assessments – please reach out to our team for a demonstration.
About our Guest Author
 |
Anthony Cornelius is the Managing Director of WeatherWatch. He has over 20 years of experience in weather forecasting and analysis.
You can find Anthony on LinkedIn here. |
Appreciate the detailed analysis