Over the weekend we posted this extended comparison of Aggregate Wind Production through (almost all of) 2024 Q2, compared to the four most recent years.
… that showed that the aggregate production of wind farms in 2024 Q2 might be worst since 2017 Q2.
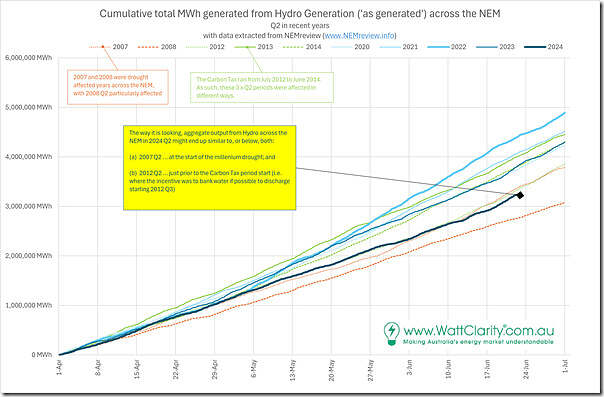
Curiosity has pulled us further, so we’ve completed a similar comparison here of hydro production levels through (almost all of) 2024 Q2, compared to both:
1) The four preceding years; but also
2) Five other years that were specifically selected for particular reason:
(a) We selected 2012 Q2, 2013 Q2 and 2014 Q2:
i. given that they straddled the 2-year ‘Carbon Tax’ period of FY 2012-13 and FY 2013-14,
ii. and so produced different commercial incentives in each year;
(b) We also selected 2007 Q2 and 2008 Q2, which were both affected by the ‘Millennium Drought’ to different extents.
Comparing hydro production levels in 2024 Q2 against 9 other years
With now 10 x ‘worm lines’ shown on this chart (including 2024 Q2 not quite complete) we see the following, as a result:
(with image now corrected for typo on the dates – thanks for the pickup!)
Firstly, with respect to the years not selected, readers should note that:
1) Prior to 2020 we used some judgement (and were led by curiosity) in selecting years for which to crunch numbers … but freely admit that we might have missed seeing other nuances in years not selected;
2) So please keep this in mind in understanding that the above is an incomplete picture.
With respect to the 10 years selected there’s a few things that jump out to this reader, including the following:
1) Of the two years we’ve selected as ‘affected by the Millennium Drought’ we see:
(a) that 2008 Q2 saw significantly lower production volumes than any of the other 9 years shown;
(b) whilst 2007 Q2 production levels were closely matched with 2012 Q2 and 2024 Q2 production levels at the bottom half of the scale.
2) Of the three years selected with respect to the ‘Carbon Tax’ era, we see:
(a) 2012 Q2 production volumes lower than 2013 and 2014 Q2;
(b) this is what we expected to see – because of the commercial incentive, given the instant revenue uplift available from 1st July 2012 when the carbon tax came into existence (if it was possible to bank hydro generation and defer its operations for a revenue boost in July).
(c) at the other end of the 2-year period, there was the opposite incentive to run hydro hard in 2014 Q2, because of the step-change loss in value once 2014 Q3 was underway.
… however it’s not apparent directly in the charts above (though Tasmanians will remember how running hydro generation hard in 2014 Q2 preceded an unfortunate quinella of lower-than-expected rainfalls and a lengthy basslink outage to result in a very tight supply-demand balance and a need to install emergency diesel generators and curtail major energy users).
3) In the most recent 5-year period, we see that:
(a) The production in 2020 Q2 was (barely!) the second lowest of the bunch of 5 years, ever-so-slightly lower than 2023 Q2
(b) Production in 2021 Q2 was ~200,000MWh higher than either of those two years
(c) Production levels in 2022 Q2 was the highest of all 10 years (almost 2TWh higher than the lowest of the 10 … drought-affected 2008 Q2)
i. This was the period of the 2022 Energy Crisis
ii. I’d forgotten about this response – but it seems clear in these numbers that hydro had ramped up to cover the loss of other supply sources
(d) We can see that production levels from hydro in 2024 Q2 look such that (if the trends continue) they might end up the second lowest of the 10 years selected.
Some factors in the lower hydro production levels
As with almost all outcomes in the NEM there are likely more than one contributing factors … without delving in any detail, I wonder about:
1) In articles such as this one about Tamar Valley CCGT we noted low levels of hydro storage in Tasmania (this Q2 period has reported as much drier than expected for southern parts of the NEM … though notably not NSW!)
… I’d also seen Vedran Kovac at Hydro Tasmania quoted in RenewEconomy as stating that low hydro levels were more significant than low wind in prompting Tamar Valley CCGT to be given a run.
2) It’s at the other end of the NEM (and smaller), but worth noting that Barron Gorge hydro has been offline since it was damaged in December 2023 by TC Jasper.
3) I’ve not had time to look, but wonder to what extend the rainfall in NSW might have affected operations of the Snowy Hydro facility?
4) I’ve also not had time to look, but also wonder if the price performance through 2024 Q2 (i.e. higher prices in the middle of the day, at least at some times) led to less opportunity for time-shifting in the pumped hydro plant (Wivenhoe, Shoalhaven and Tumut) … hence less generation during ‘peak’ periods from those facilities?
Obviously more for someone to delve further into, as time permits….


The 66 MW Barron Gorge Hydro Power station is just coming back on line since Cyclone Jasper in December 2023 BUT due to a very long and good Wet Season in the highest most reliable rainfall region in Queensland (if not Australia), the 88 MW run-of-river Kareeya Hydro Station in Far North Queensland has operated almost 24/7 since Cyclone Jasper ie its basically operated as a baseload rather than peakload power station for over 6 months and continuing to do so as the Koombooloomba Dam that supplies Kareeya Power Station is at 90% capacity. Its over 60 years old so its printing clean $ for its owner – the Queensland Government.