As we have earlier done for 30th and 31st January and 1st February 2020, in this article we’ve reused my own derivation of ‘Underlying Demand’ to take a look at what happened with demand by that measure back on 1st Feb 2011, because that’s when there was a high point for ‘Market Demand’.
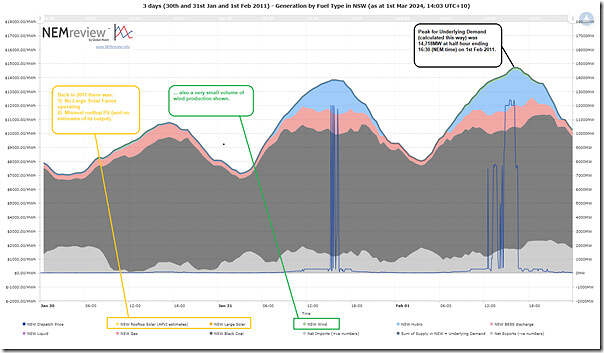
Here’s the three day trend, produced using NEMreview v7:
As per prior articles, those with a licence to the software can open their own copy of this query here.
With respect to VRE back in 2011:
1) There were no Large Solar Farms installed;
2) Whilst there would have been a small number of rooftop PV systems deployed:
(a) there were no (AEMO, APVI or other) estimates of their output; and
(b) the contribution would have been low in any case.
3) Additionally, we can also see a very small contributions from Wind Farms back at this time.
From that chart we see that the highest point was at 14,718 MW for the half hour ending 16:30 (NEM time) on Tuesday 1st February 2011.
This point was below that derived for Thu 29th Feb 2024.


Leave a comment