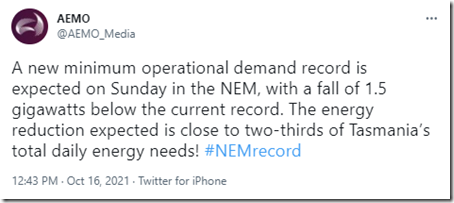
I’d just finished a quick review of current demand levels with reference to today’s levels as part of posting this quick snapshot of some interesting QLD events on Saturday 16th October than I noticed AEMO had tweeted its expectation that the demand would fall further tomorrow (Sunday 17th October) and set a new ‘record low’ point for minimum demand:
Thanks for flagging!
Readers are reminded that AEMO most often speaks about ‘Operational Demand’ these days (you might think of it as ‘Grid Demand’ … i.e. demand they can easily see in real time, with the this start on the gory details* explained here).
* we have identified that it’s time to update and extend this explanation as a number of things have emerged to make it even more complicated (like how Negawatts will be dealt with in various AEMO measurements with the advent of the Wholesale Demand Response Mechanism in just over a week)
(A) The prior lowest point was on Sunday 3rd October 2021
The prior lowest point for NEM-wide demand was back on Sunday 3rd October 2021 as discussed here – in which article I noted that:
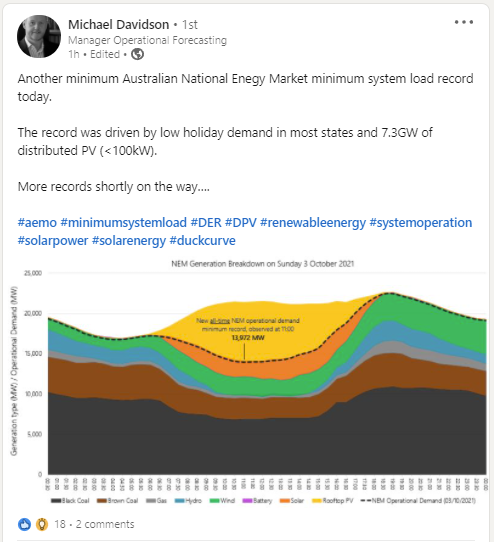
1) A low point for Scheduled Demand (13,273MW target for 10:55 interval on Sunday 3rd Oct) … which is down on the 13,509MW prior low point from 13:05 on 22nd August 2021.
2) A low point for Operational Demand (13,972MW measured in half-hour ending 11:00 on Sunday 3rd Oct) … which is down on the 14,193MW prior low point from the 13:00 half hour on 22nd August 2021 … which I noted with a PS that Mike Davidson at the AEMO also posted more detail on LinkedIn here about this record low-point on Sunday 3rd October:
This AEMO confirmation was also tweeted here.
(B) Let’s watch what happens
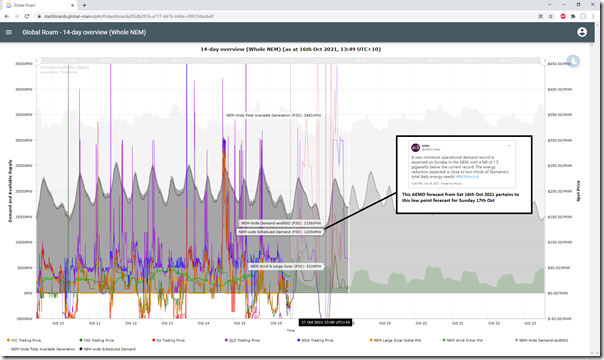
Some time ago, using our ‘Trends Engine’ available in ez2view I recall creating this dashboard of NEM-wide data, looking back 7 days and forward 7 days … and publishing to share with those who create a unique account with us to log into the live-updating dashboard service here. Here’s how it currently looks (with data to 13:44 on Saturday 16th October):
At this point, the forecast is for NEM-wide demand to be down at:
1) If looking at ‘’P30 ‘Total Demand’ (i.e. a measure of Scheduled Demand) down at 12,094MW in the half-hour ending ** the five minute period ending 13:00 NEM time; and
2) If looking at P30 ‘Demand and Non-Scheduled Generation’ (i.e. used to be closer to Operational Demand, but is diverging) down at 13,285MW in the half-hour ending ** the five minute period ending 12:00 NEM time.
** PS, and Oops … tripped on the Tripwires!
I realise, belatedly, that Tripwire #1 has tripped me up in what I had written above … in that I had written that those measures were for ‘half hour ending’ 13:00 and 12:00 respectively. But from the start of 5MS that is no longer the case, as P30 references the 5-minute period ending HH:00 or HH:30.
… or perhaps, as Marcelle noted with Tripwire #2, it’s even more confusing than that!
—
Remember that you should be able to log in here to watch what unfolds…


Leave a comment