A short article today to make two quick observations with reference to these two articles:
The two articles are linked here:
1) On the left is my article, published Friday 28th May, noting that ‘There were 3 events on Tue 25th May – and it seems likely that QNI separated briefly in Event 2’; and
2) In some weekend reading, I came across a chart in Giles’ article on Thursday 27th May stating ‘Hornsdale battery steps in to protect grid after Callide explosion’. I also see that this article has been reference heavily on social media.
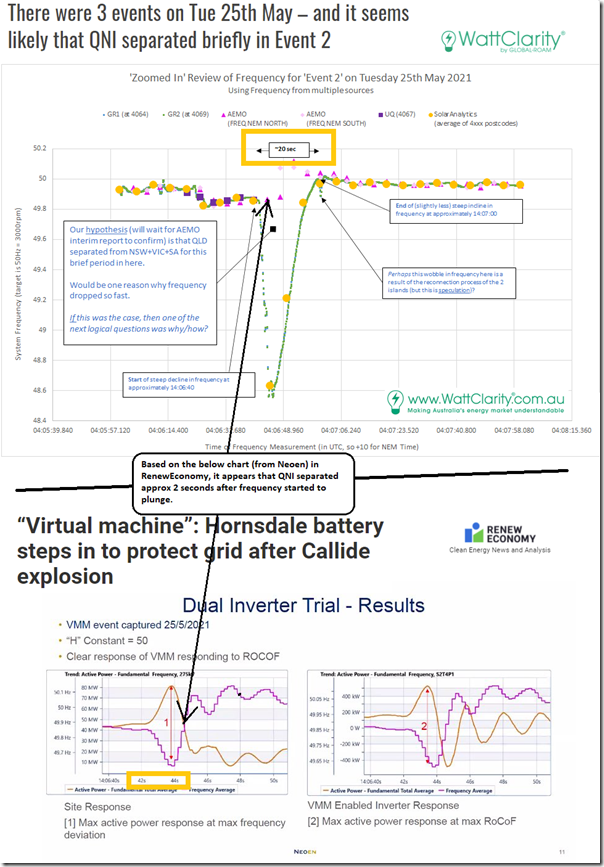
If you open up both articles in the links above, there are 2 graphics that prove useful when viewed together (best side-by-side in different tabs). I’ve placed them above and below, and annotated, because of space constraints in the reading window:
Keep in mind that there are difficulties in ensuring accurate time readings on high speed devices, so don’t worry too much if the time stamps are a second or two different. What’s more important is the shape of the frequency trend.
In the top chart (from WattClarity) we see the frequency plunging from 14:06:40 (remembering that this is Event 2, and that there were two earlier dips we labelled Event 0 and Event 1). In the bottom chart (from Neoen via RenewEconomy), we see this starting at 14:06:42 and lasting 2 seconds before the frequency started to swing back upwards.
Remember that the initiation time might not be identical, but it is the 2 second period that seems the more important observation.
From this it seems clear to me that:
Observation 1) The point at which the frequency turns would seem to be pretty close to the point where QNI separated:
This is 14:06:44 in the Chart on RenewEconomy – and perhaps 14:06:42 in my chart above.
Observation 2) At this point:
2a) The southern regions could no longer lend support to QLD (including the Hornsdale Power Response ‘Virtual Inertia’ service highlighted in this article – but also (with less acclaim, perhaps) all the other units providing PFR in the south).
This would have caused the frequency in the south to rise quickly (as shown until that support was dialled back – shown in the chart for Hornsdale, but also would have happened for PFR).
2b) As noted on Friday, the much lower level of inertia in the QLD grid (unsupported by the south and with the loss of so many synchronous units in QLD) would have experienced high ROCOF, with the frequency correction achieved through major UFLS in QLD and (electrically connected) northern NSW.
We’ll see after more investigations have been performed, but it seems possible that Regulation FCAS signals might have been sent to QLD generators to have them lower frequency (i.e. based on rising southern frequency) whereas they should have been striving to raise (because of ‘NEM North’ being measured in Sydney).


I remember the islanding that had the QLD generators being given AGC set points based on NSW frequency, while trying to deal with local frequency going in the opposite direction.
Thought AEMO would have fixed that by now.
AGC probably wasn’t an issue here as the two systems appear to have synchronised and reconnected within 15-20 seconds, which is a remarkable outcome – fantastic recovery of frequency in Qld after the under-frequency load shedding, and some very clever controls on QNI. The recovery in Qld must have largely been due to primary frequency response from the Queensland units remaining online. While lots of things went wrong in this event, some very important things went right.