
This article was originally posted on LinkedIn, where there are other comments. Reproduced here with permission.
It has now been over a year since City of Newcastle (CN) made the switch to a 100% renewable electricity supply contract, as one of the first Local Governments in Australia to do so. For those that love energy data, it tells an interesting tale.
On New Years Day 2020, CN officially switched over to 100% renewable electricity supply for all its operations, including all of our large sites such as libraries, galleries, administration centres and works depots, over 200 small sites and more than 14,000 street lights. Four days into the contract, we faced a significant test, with chaotic events sending the spot market price to $14,700 per megawatt hour, more than 165 times the previous year spot price average. I covered this event in detail in a previous post here and while we did relatively well out of this singular event, I was more interested to see how we’d track over the long term.
Implementing a 100% renewable electricity contract
To explain briefly how our 100% renewable contract works, CN purchases electricity for its operations through an electricity retailer as part of an Energy Supply Agreement (ESA). Instead of being at a fixed price, it is purchased from the spot market which operates on a half-hourly basis. At the same time, CN has a supplementary agreement with its electricity retailer to buy the same amount of electricity from a renewable energy generator (in this case Sapphire wind farm).
This is otherwise known as a Retail power purchase agreement (PPA), Renewable PPA or a Virtual Generation Agreement (VGA).
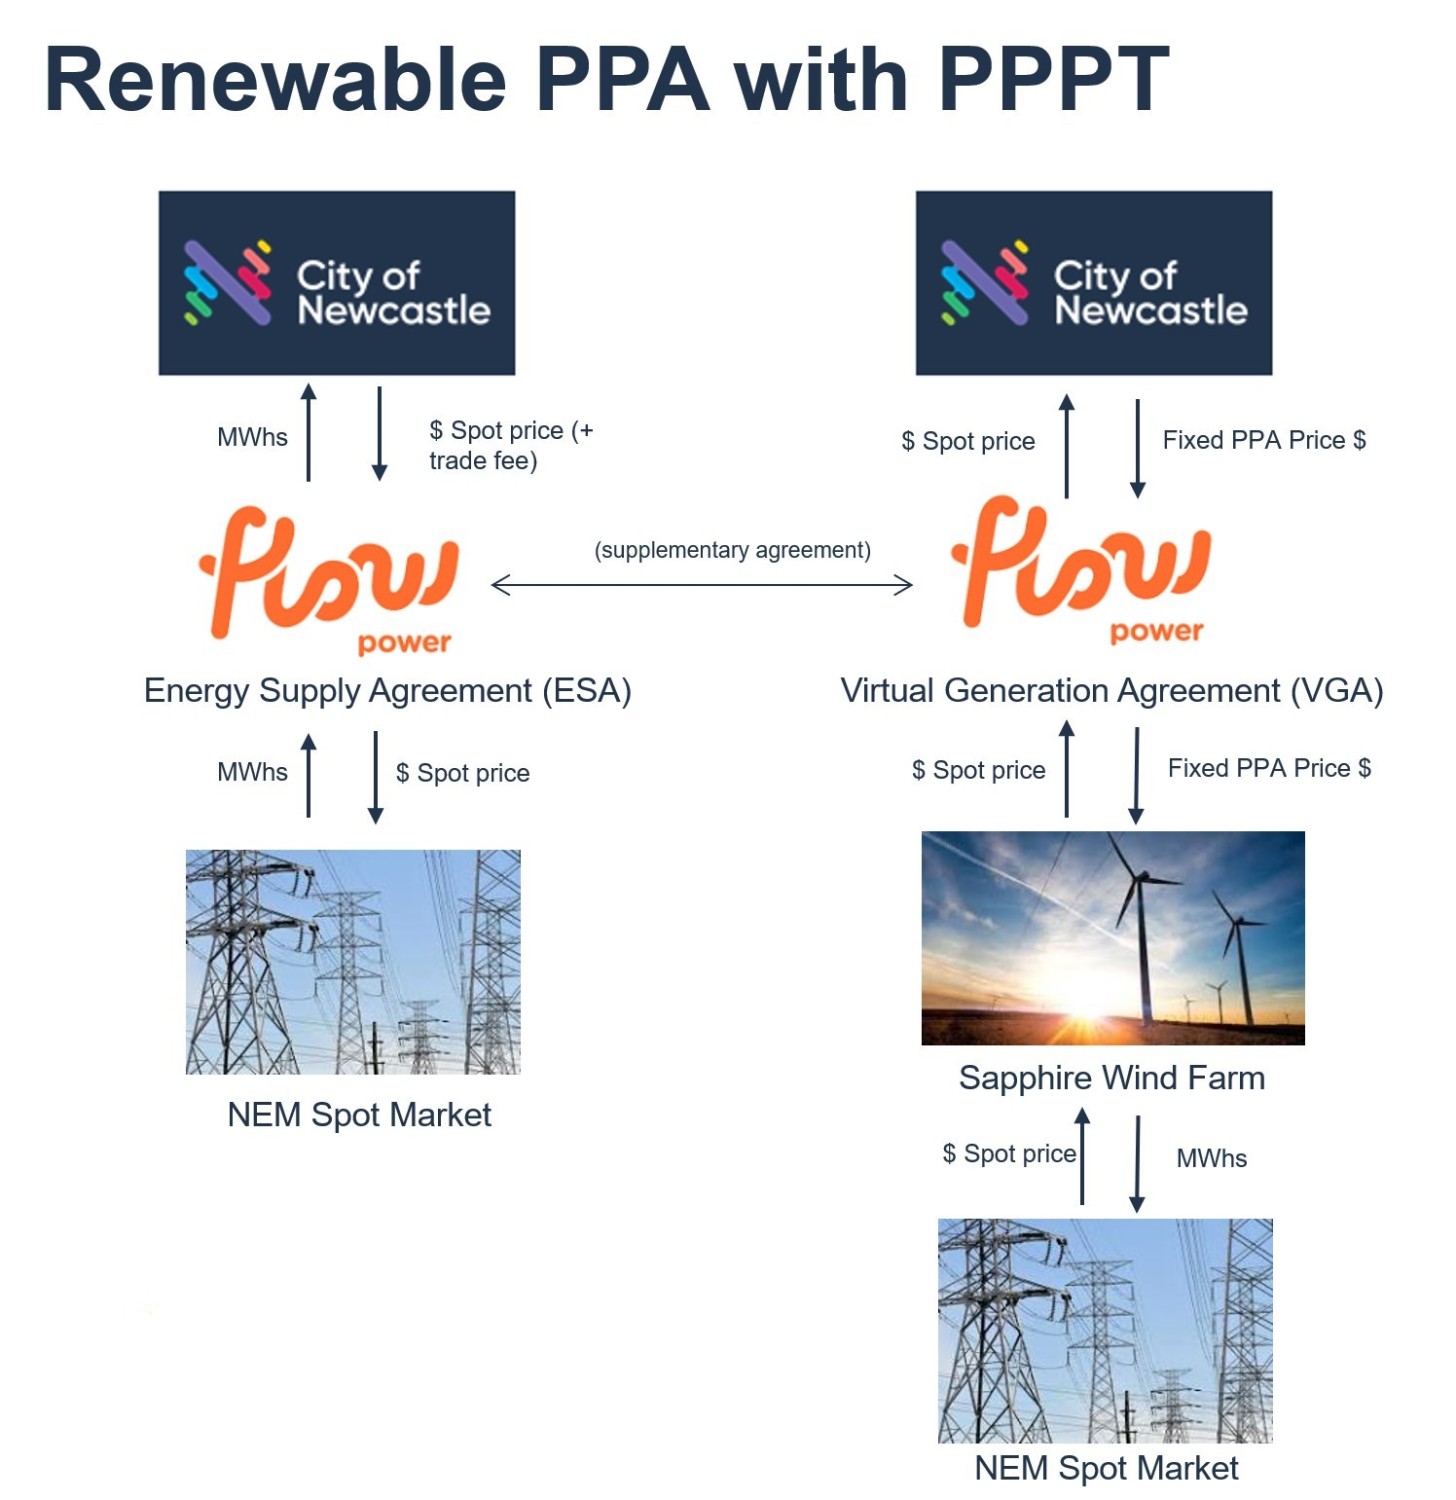
Figure 1 – City of Newcastle Electricity Contracts
While it may look a bit complex, in practice, the ins and outs are all managed by an electricity retailer. This means that as a customer, CN receives a bill each month for our sites, as we would with any standard electricity bill.
Comparing our progress on a 100% renewable electricity contract compared to a standard agreement (or Business as usual) is where it gets interesting. Are renewables cheaper or more expensive? What is our exposure risk to fluctuating electricity prices instead of fixed prices? How often is the wind not blowing or the sun not shining? What else can we do to manage our electricity use?
First, the finances
Our business case modelling prior to signing a renewable energy contract had shown good prospects of not only supporting renewables but also achieving significant financial savings on our electricity contract. Having now had over a full year of actual data (albeit in interesting circumstances due to Covid-19), the case continues to stack up for our new approach to energy management. Despite a volatile January 2020 period and a few more blips throughout the year, City of Newcastle is tracking well ahead of its business-as-usual (BAU) projections.
Each month through 2020, City of Newcastle’s 100% renewable contract performed better than a BAU projection with the exception of January and December.
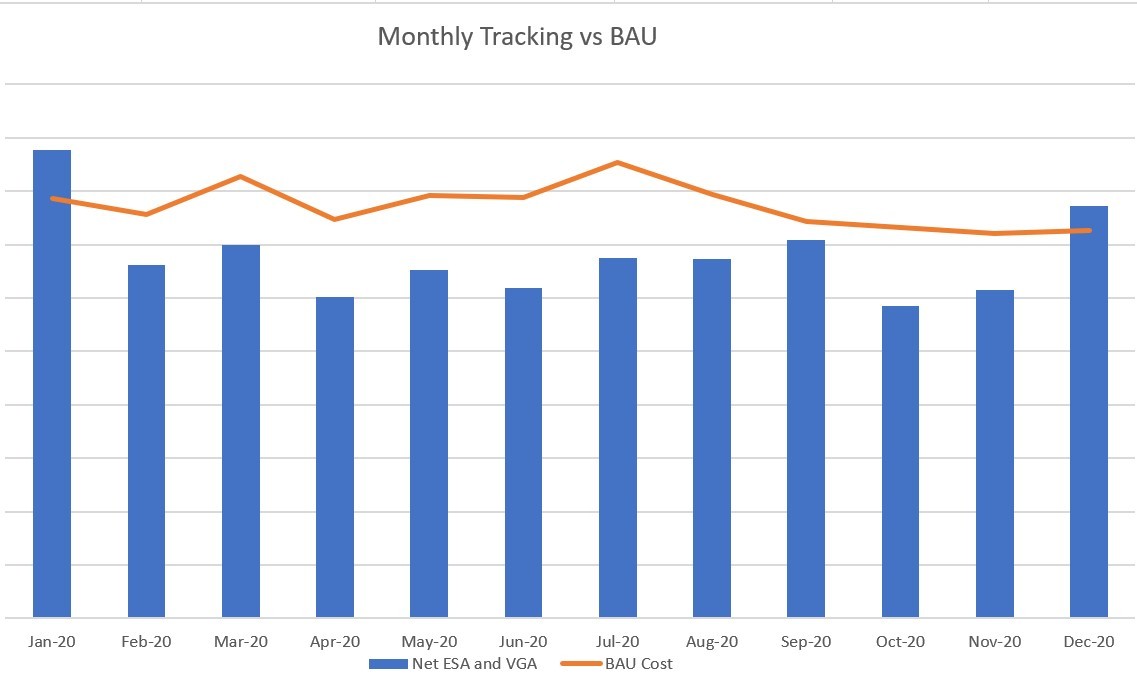
Figure 2 – City of Newcastle 100% renewable electricity contract (Net ESA and VGA) compared with Business As Usual (BAU) projections.
The cumulative effect of this over the twelve-month period of 2020 results in a cost reduction of 12.15% against BAU, while achieving a supply of 100% renewable electricity. It is important to note that this analysis relates to the delivery of electricity rather than the associated emission reduction which comes from Large-scale Generation Certificates (LGCs). While purchasing 100% renewable electricity, City of Newcastle also sources enough LGCs through both self-generation and procurement to offset emissions and reach its 100% renewable electricity goal.
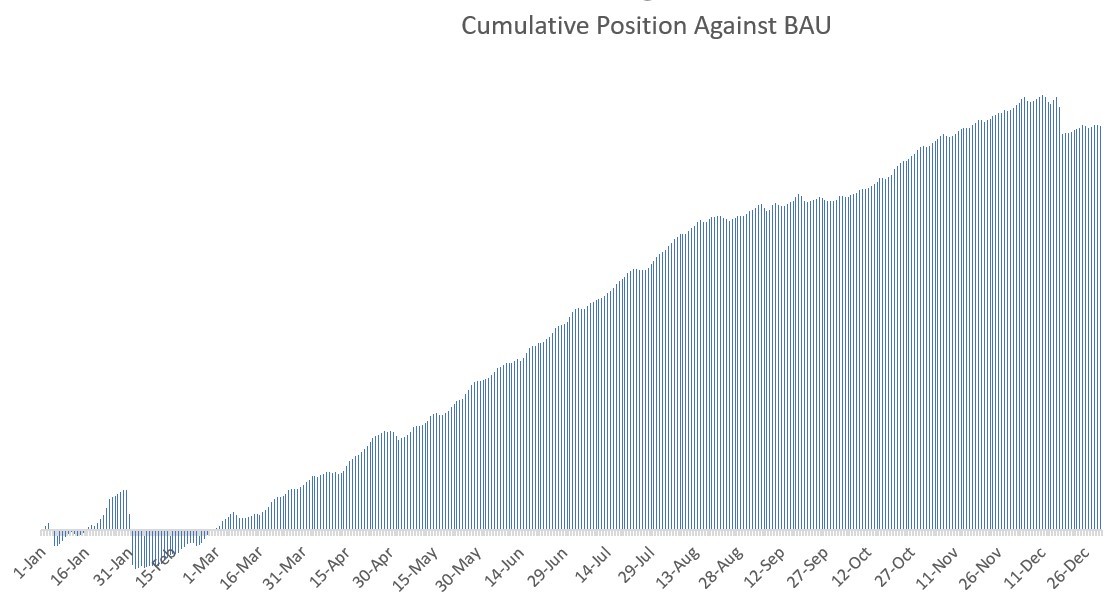
Figure 3 – Cumulative $ savings against BAU – 2020
Except for two particularly volatile days in January, which took until the end of February to recover against, the figure above emphasises that the rest of the year has shown steady cumulative savings from receiving cheaper electricity supply through the renewable energy contract.
Matching renewable generation against City of Newcastle electricity use
As renewable energy supply in the grid increases and we start to see oversupply, particularly in the middle of the day, matching this output with the electricity demand of customers will become more and more important. To achieve this, there needs to be a good understanding of an organisation’s electricity load profile. CN operates a wide range of buildings and facilities, including over 14,000 streetlights, so this detailed understanding of electricity use was a critical component of finding the right renewable generator to complement this load profile.
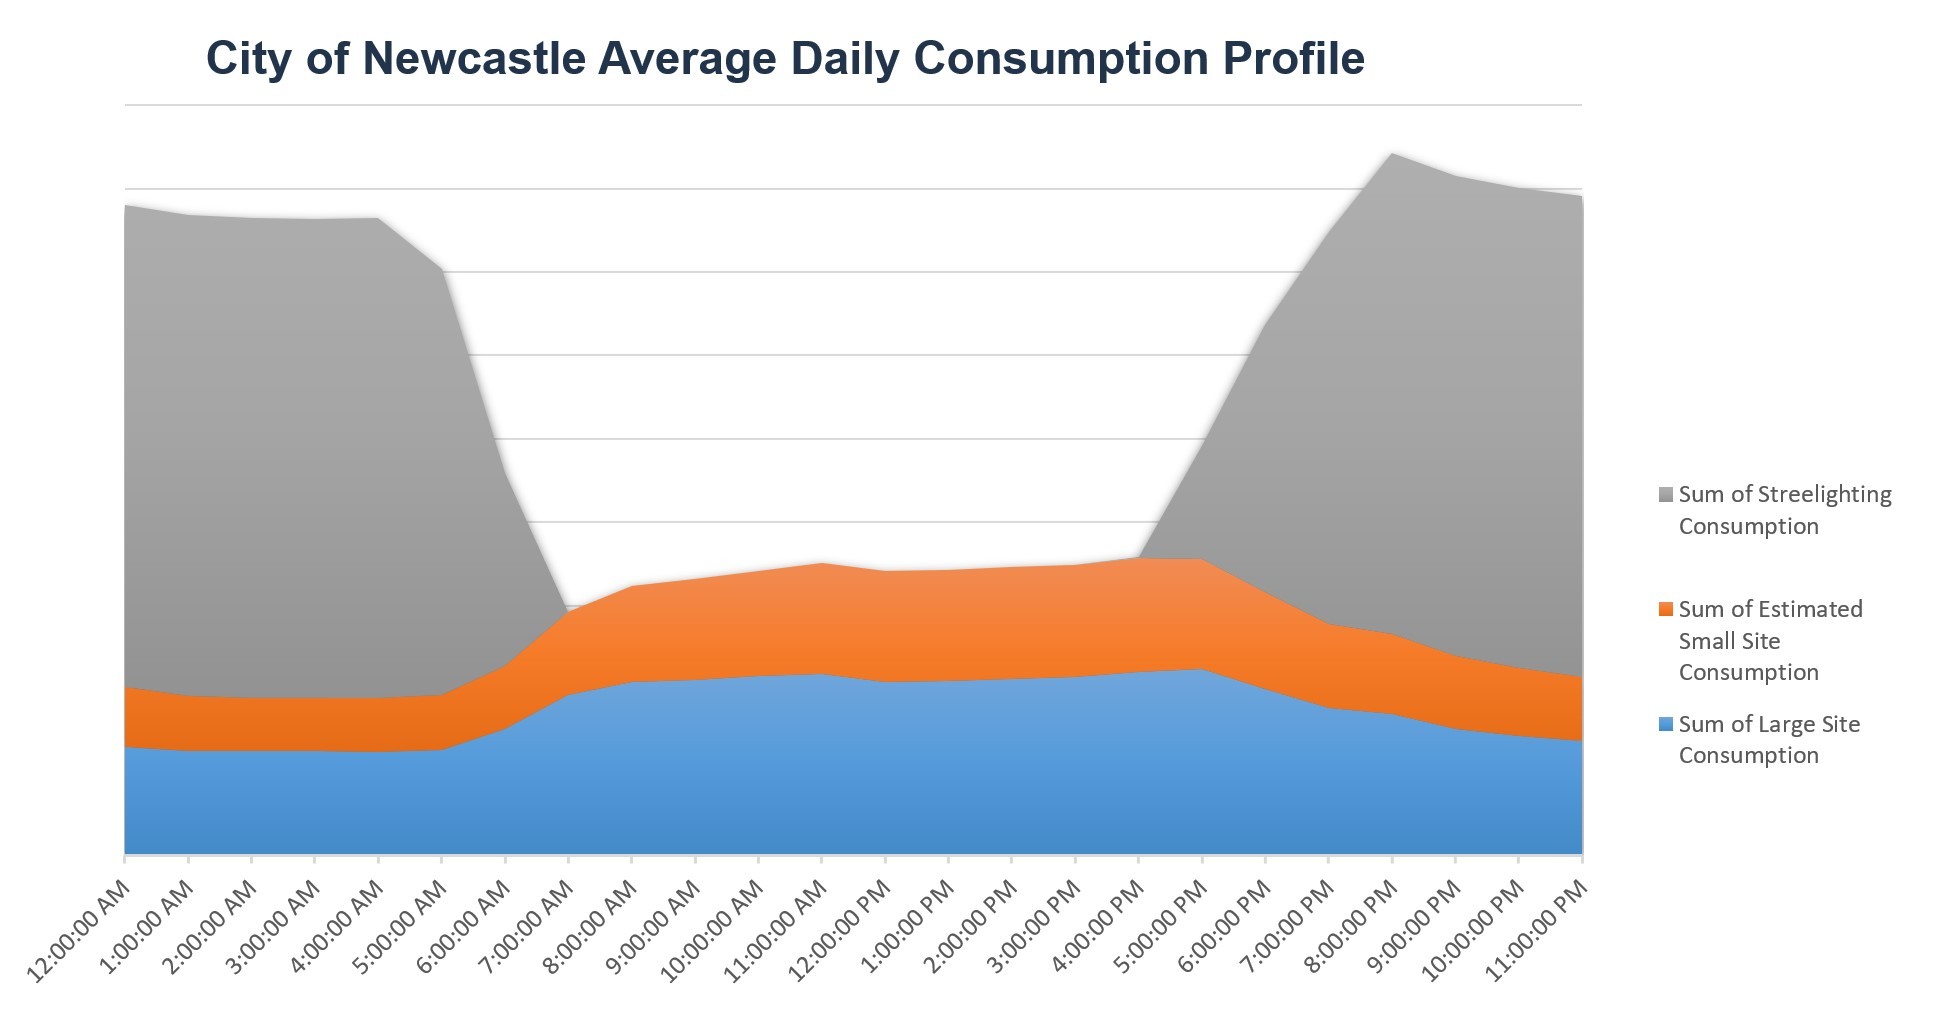
Figure 4 – Average daily load profile
The graph above shows that electricity usage for buildings and facilities predominately occurs during the day. Through an ongoing program at CN of installing solar PV across sites, this daytime demand has been greatly reduced over time. The biggest single area of electricity usage however is street lighting, providing a strong case for alternative renewable energy generation other than Solar power. The best match for providing this high evening generation turned out to be Sapphire Wind Farm.
Renewable Supply vs Demand 2020 performance
The renewable electricity contract has been sized to meet 100% of City of Newcastle (CN) electricity usage over the course of a year, including over 200 small sites. In application though, the generation is applied against load demand from large sites (C&I) and the Street lighting, with small sites (SME) treated separately for a number of reasons. Without going too much into detail, this structure also has the advantage of raising the supply/demand matching between the renewable generation and CN electricity usage.
Mapping the actual half-hourly City of Newcastle electricity usage from large sites and street lighting over the course of a year against the electricity purchase from Sapphire Wind Farm over the same period provides a number of interesting data points and considerations.
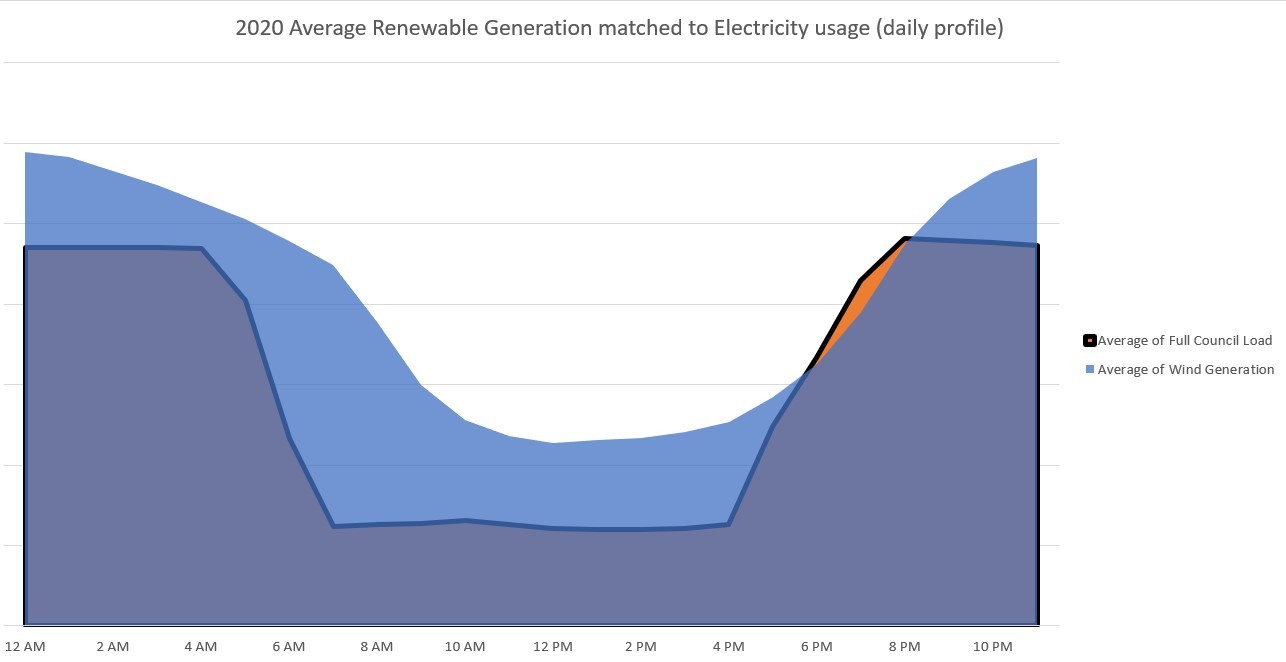
Figure 5 – City of Newcastle Electricity use matched to Renewable Electricity purchase
The graph above shows the output of the Sapphire Windfarm in blue (rated down to the % purchased by City of Newcastle) overlaid on the CN electricity use (in Orange) for large sites and street lighting for 2020. For all but a small period of the day between 6pm and 8pm, this average daily profile shows that there is enough renewable energy being produced to effectively power CN requirements and provide a hedge against spot market price volatility. With minimal battery storage, demand response or some energy efficiency works, the exposed load in the evening can be covered and therefore no longer exposed to potential high electricity spot-prices. This is already in train with the accelerated upgrade of street lighting to LED, significantly reducing night-time electricity use. A number of battery storage systems have also been installed at large sites with more on the way. This is part of City of Newcastle’s Climate Action Plan to firm renewable supply and build resilience across CN operations.
The graph above also shows excess supply from the Wind farm and this is because it has also been purchased to cover small site electricity usage (not shown above) and to provide future capacity for increased electricity usage from CN fleet including electric cars, electric trucks and heavy equipment.
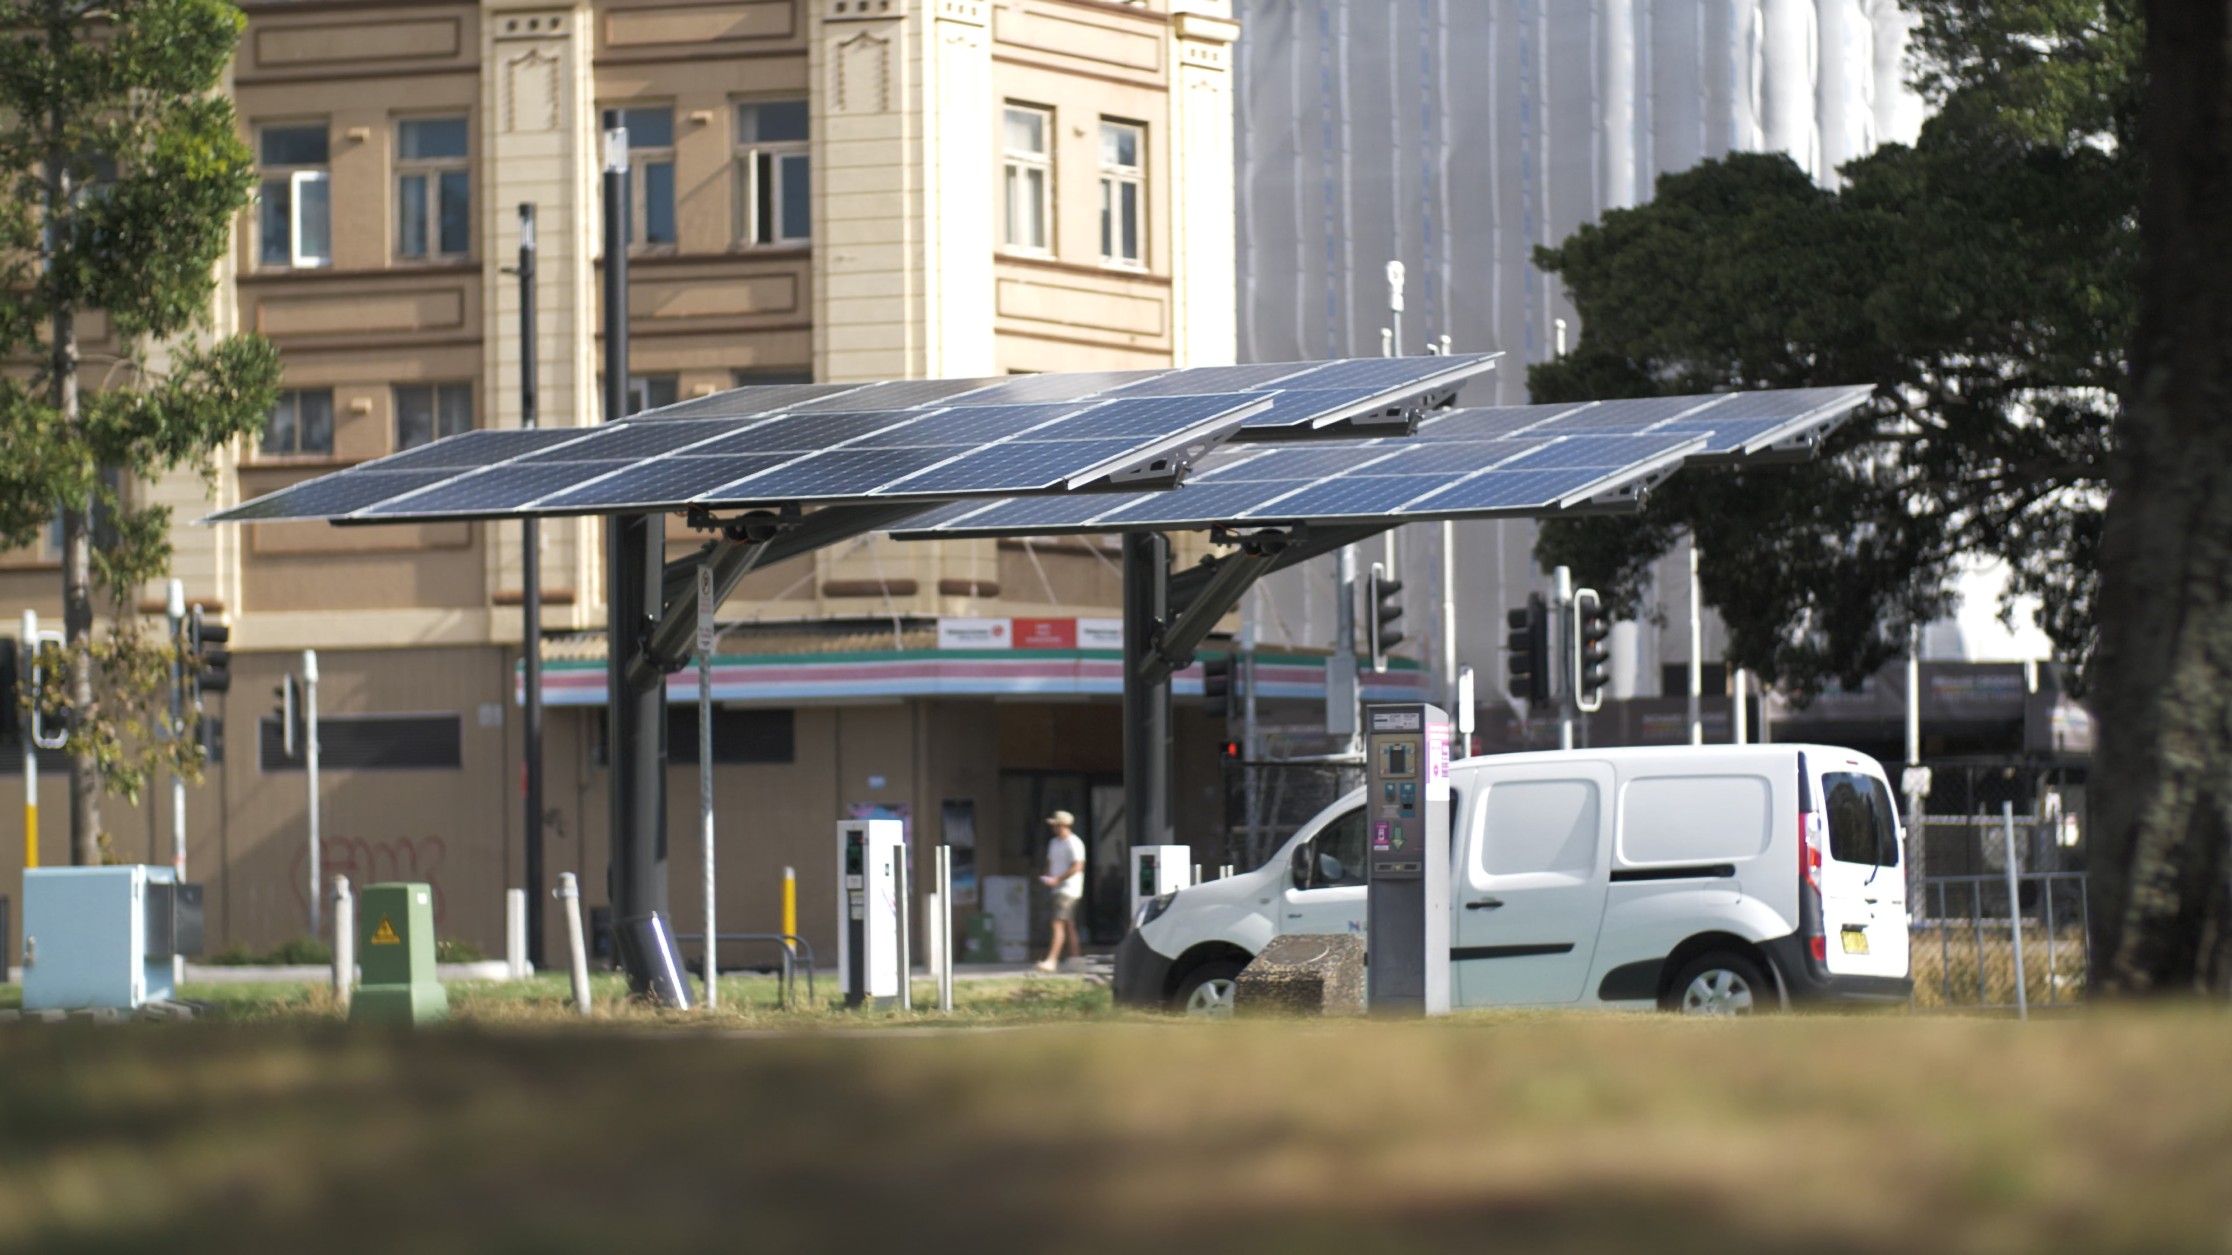
Figure 6 – City of Newcastle Public EV charging and electric van, powered by onsite renewables and 100% renewable supply contract
Bringing it up a few levels to assess monthly performance over the course of the year, again shows strong results, with the windfarm supplying enough power in the aggregate to meet electricity consumption from CN operations every month of the year except June. For June, it just fell short of meeting total electricity demand by only 0.003%.
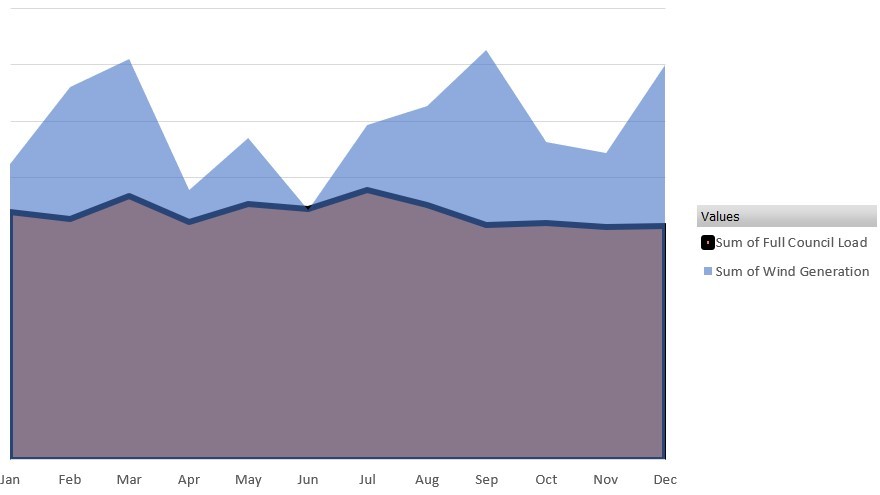
Figure 7 – Renewable Supply vs CN Electricity Demand, Monthly view
A Deeper dive
Looking closer at each of the 17,568 half-hourly periods in 2020 provides even further insight for those that like to get down in the weeds of energy data. It also gives some indication of the challenges in matching supply to demand in a future grid of much higher renewable energy penetration and as we move to a five-minute settlement market.
While much more could be written here, I’ll try and summarise in a short table:
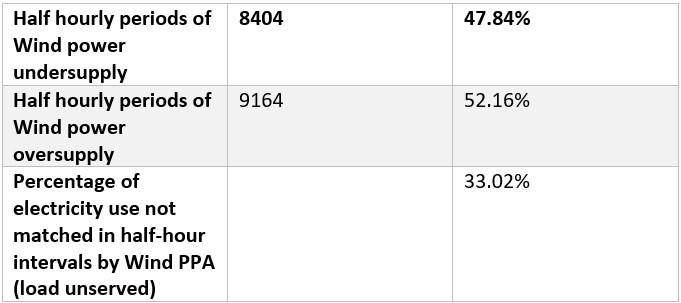
This shows that for more than two-thirds of all CN electricity supply, the windfarm was generating enough power to match this on a half-hourly basis, without requiring any firming. It is also worth noting that this is when comparing a single source of renewable supply. By sourcing renewable electricity from a range of different generators, in different geographic areas, this matching can easily be much higher and reduces the need for large amounts of firming such as battery storage.
In fact, when we add in the excess renewable generation exported from City of Newcastle solar assets, the amount of matched electricity on a half-hourly basis rises to nearly three-quarters. In other words, only 26.54% of total electricity consumed over the year is during periods when there is no wind or solar being provided to CN from its Wind PPA or solar generation assets. This hybrid wind and solar supply is becoming increasingly popular for PPAs and identifies opportunity for a relatively small target to firm with battery storage or other options.
Where to now?
With the supply side of things locked in, there is now further work to be done in focusing on the demand side and reshaping our electricity load profile for maximum benefit. This includes street lighting upgrades as mentioned and other energy efficiency initiatives, as well as developing a demand response program. In tandem with this, the Climate Action Plan targets further increases in battery storage across sites to reduce peak electricity use and provide firming for renewables and to investigate opportunities in emerging technologies such as vehicle-to-grid (V2G).
As we begin to increase the number of electric vehicles in our fleet and transition our trucks and waste collection vehicles to electric options, we have also begun implementing smart charging capabilities to balance this additional demand. This includes using spot-market price signals to optimise our charging schedules. With the market moving to five-minute settlement from the current half-hourly intervals, having greater understanding of the data and the tools in place such as battery storage to flexibly and rapidly respond, will set CN up for even further electricity cost reductions as we work towards supporting a net zero emissions future.
————————————–
About our Guest Author
 |
Adam Clarke is the Sustainability Manager at the City of Newcastle delivering renewable energy, smart city and sustainability projects. He is responsible for developing and implementing projects for financial and environmental returns for the City.”
You can find Adam on LinkedIn here. |
I just love the justification for intermittent t supplies being based on averages, while in reality, “ 26.54% of total electricity consumed over the year is during periods when there is no wind or solar being provided to CN from its Wind PPA or solar generation assets.”
Unfortunately electricity system design is not based on averages.
Hi Ben
Nearly three quarters of supply being matched without firming or detailed DR is a pretty good start. This is a financial contract though not a power system design. I don’t believe managing grid reliability should be a customer responsibility?
“I don’t believe managing grid reliability should be a customer responsibility?”
It’s a fallacy of composition to believe we can all take that view. As for opportunities with V2G I fail to see why on earth you would want to make any necessary grid firming battery capacity mobile rather than fixed. After all if our vehicle batteries are larger than they need be in order to firm the grid that’s simply more wasted energy lugging them around wouldn’t you think?
“A fallacy of composition” – I’d be interested if you’d like to expand on that. When you fuel up at a petrol station, as long as you have a compliant vehicle, is it your responsibility to ensure there’s fuel supply? What’s the difference with grid supply?
As for V2G (and I’m no expert), no doubt vehicle batteries will be oversized for customer convenience (who really needs to travel 400km without stopping?) but the broader point of v2g I think is vehicle utilisation. Vehicles are usually not required for their primary purpose (driving) 24 hours a day.
When I fill up with diesel or 91-98 octane petrol for that matter I’m guaranteed full measure and a quality standard although the price varies depending on competitive supply and seller costs. I won’t expect the same price at William Creek and Adelaide that’s for sure but you’re free to set up in competition to any of them. What I don’t want is my car to play up down the road and be told that’s the way it is sometimes as the Premier’s nephew has special rights to deliver his special Green brew as much and as often as he likes but the quality is dependent on the weather.
As for being forced to buy an expensive BEV only I won’t be thinking about my duty to save the unreliable grid with its battery sizing anymore than servo sustainability with my ICE choice now. After all it’s my hard earned and I don’t have the luxury of sticking up everyone’s rates to finance my particular preferences be they judicious or profligate. Naturally if there’s a cushy Council job going with a long range Tesla thrown in I’m all ears but then we come back to that fallacy of composition problem.
Whilst local Councils or we as individuals can fiddle around the edges with the communal grid the really big picture problem is State mandated dumping-
https://en.wikipedia.org/wiki/Dumping_(pricing_policy)
Normally the ACCC would be all over such practice by wind and solar but instead we have the silence of lambs.
Thanks Adam – really interesting stuff. What would be even more interesting would be a net load duration curve for the year: i.e. for each half hour (soon to be 5 minutes…) load – own PV output – the scaled output from the wind farm. this would capture your exposure to spot outcomes and address Ben’s point about averages.
Thanks Kieran, I’ll put that together. Also interested when I have time to see the actual firming size required and also to evaluate average pricing during those periods of unserved load – ie from a financial perspective wouldn’t necessarily need to cover spot-exposed periods of low average prices. That’s where looking and covering the early evening exposure will be the first step.
Hi Adam – great article. Couple of questions –
1) How did you define the BAU scenario?
2) “It is important to note that this analysis relates to the delivery of electricity rather than the associated emission reduction which comes from Large-scale Generation Certificates (LGCs).” – is this saying you haven’t factored in the cost of the LGCs in this comparison?
Hi Sean
1 – BAU is based on fixed price contract pricing supplied at time of tender when the PPA was entered into (I.e the contract we otherwise would have entered into).
2. There’s further commentary on the original post, but yes this is a like for comparison on electricity supply, not emission reduction schemes.
Nice article Adam. I did a similar analysis for the ACT’s 100% renewable target that you may be interested in. I contrast to NSW, the ACT is using a mixture of wind and solar to meet its needs. Perhaps the main headline from this was that 75% of the ACT’s needs could theoretically have been covered by the wind and solar generation without any storage. Kieran, it includes some generation duration curves!
https://sites.google.com/view/100-renewable-act/home
Interesting article Adam
Two questions;
1) How would the BAU comparison look if referenced to todays wholesale price – it looks like you have set a BAU baseline based on a market highpoint versus the collapsed wholesale prices of today
2) what controls do you have to ensure Flowpower / Sapphire are not selling the same Mwh of generation to multiple end customers
Great work Adam.
This kind of analysis is crucial as we move the world towards True Zero (as opposed to Nett Zero) carbon. In the past 6 months we’ve seen Google, Microsoft and IBM all commit to this idea – 100% renewable energy procurement without relying on offsets of certificates. In Europe there’s even a as standards push (energytag.org) towards making RECs completely time based, and it’s what Enosi’s Powertracer is designed to do as well.