Late this afternoon (16:05), the AEMO published Market Notice 80269 warning of a LOR1 Low Reserve Condition forecast to occur next Monday afternoon (30th November 2020) from 14:30 to 16:00, and then again from 18:00 to 19:30.
This prompted a brief discussion with a team member in the office about how rare it is to see an LOR1 condition (either actual, or forecast) for the QLD region – because we just have so much installed capacity at present in comparison to demand levels.
Well, on the walk home one of our SMS Alerts from ez2view reached me and alerted me that AEMO had subsequently upgraded the forecast with Market Notice 80270 and is now noting the possibility of an LOR2 LRC condition forecast for next Monday from 13:30 to 20:00:
AEMO MARKET NOTICE 80270 – STPASA – Forecast Lack Of Reserve Level 2 (LOR2) in the QLD Region on 30/11/2020 – AEMO Investigating.
MARKET NOTICE 080270
__________________________________________________
Notice ID : 80270
Notice Type ID : LRC/LOR1/LOR2/LOR3
Notice Type Description : MARKET
Issue Date : Monday, 23 November 2020
External Reference : STPASA – Forecast Lack Of Reserve Level 2 (LOR2) in the QLD Region on 30/11/2020 – AEMO Investigating.
__________________________________________________
AEMO ELECTRICITY MARKET NOTICE
STPASA published a Forecast LOR2 condition in QLD region for the following period:
From 1330 hrs to 2000 hrs 30/11/2020.
The forecast capacity reserve requirement is 406 MW.
The minimum capacity reserve available is 187 MW.
AEMO is currently investigating the cause of this forecast LOR 2 condition.
Manish Bhaskar
AEMO Operations
The peculiarity of it all can be inferred in the AEMO note in the title for the Market Notice ‘AEMO investigating’. It’s not often I can remember seeing that, either.
Readers should keep in mind the following three points:
Reminder #1) An LOR2 condition is more severe than an LOR1 condition was explained here in the expanding Glossary on WattClarity;
Reminder #2) This is a forecast, and the primary reason for forecasts are to encourage market response. Hence it is very unlikely that such a condition should actually be in place by the time we get to Monday next week
Reminder #3) I’m also aware of the possibility that this situation is partly a result of the compressed outage season, a carry-over of COVID restrictions that stymied outages that would normally have run in autumn 2020 (as noted here previously).
Reminder #4) Without looking at any data, it’s also quite possible that the forecast condition is the result of some ‘fat finger error’ with some trader entering the wrong availability data in their bid.
Nevertheless, what did they say about ‘curiosity killing the cat’? I thought I might use ez2view to explore briefly this evening…
(A) What’s visible in the software online?
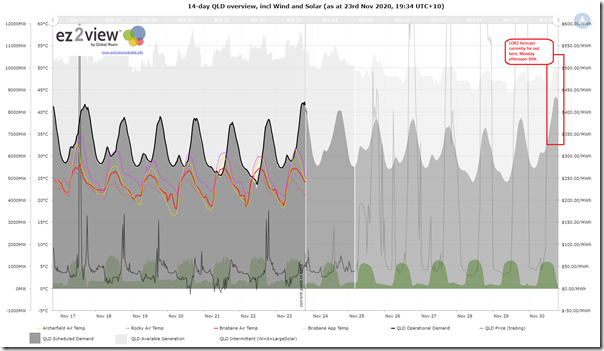
Knowing I’d refer to it quite frequently, I’d previously put together this live-updating trend chart using the ez2view online component of the software (soon to integrate more closely with the larger installed component when we release v8):
We can see that the forecast for demand on Monday next week is for it to be a shade higher than what it was today. The bigger difference comes when we look at Available Generation and see it is forecast to be:
—
Note in this trend I have used the MMS field ‘STPASA QLD (Outage LRC) Aggregate Capacity Available’, which is not a perfect like-for like comparison with Available Generation in the dispatch timeframe, because of the different treatment of VRE. However it is interesting to see it noticeably lower, and I wonder what has contributed?
(B) In the (larger) installed component?
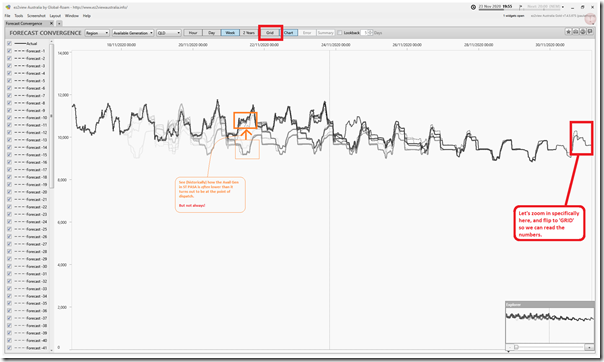
The larger installed component of the ez2view provides much greater capability (more coming with v8 shortly) – and this includes the ‘Forecast Convergence’ widget, which I can use to see how successive ST PASA runs have changed that forecast for Available Generation out on the 30th November:
IN orange I have highlighted how the ST PASA forecast are often (but not always) lower than what happens at the point of dispatch.
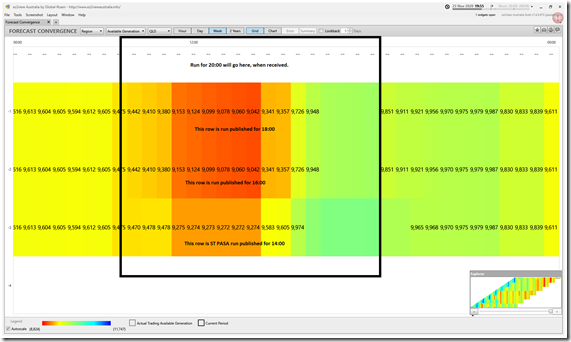
As noted on chart, we’ll zoom into the far-right of the chart (i.e. focused on forecast for Monday afternoon next week) and flip to ‘GRID’ view so we can read the numbers:
We can clearly see the drop in available generation capacity between the run published at 14:00 and the run published at 16:00 this afternoon. So this will be one reason for the escalated Low Reserve Condition alert (i.e. LOR1 becoming LOR2).
That’s all I have time for now…


Be the first to comment on "Surprise LOR2 (Low Reserve Condition) forecast for QLD next Monday afternoon, 30th November 2020"