It’s been a busy week – more broadly in the NEM (with a number of separate developments) but also for us (e.g. will look forward to showing a larger number of people more of the new version of our Generator Catalog in the not too distant future, as something which will make software like NEMreview and ez2view work more easily but accessible in its own right).
One of the articles posted earlier this week was what turned out to be a longer exploration of the chronology of Oakey 2 Solar Farm, which has been referenced in a few different places already that we know about. This was one of the articles that attracted a fair amount of attention – and also quite a number of different pieces of feedback (including questions along the lines of “whilst you’re looking at individual power stations, can you tell me what’s been happening with [INSERT NAME] Power Station?”.
So whilst I wait for one other thing to finish this evening before I clock off for the day, I thought I would take a quick look at one of those in particular, the Bald Hills Wind Farm in Victoria:
(A) Chronological Record over 18 months
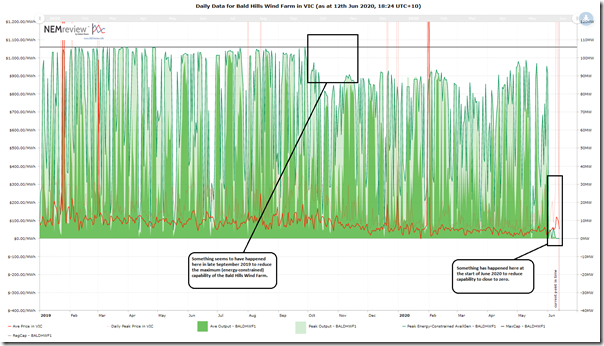
I’ve quickly pulled together this query in NEMreview v7 in order that I might see the high-level trend in output:
I’ve marked on the chart two particular periods of time where there’s a noticeable shift in performance:
Change #1 seems to occur in from late in September 2019, where the peak output capability of the wind farm seems to drift down, over a couple weeks, from the 106MW Maximum Capacity of the plant (which the plant had reached on a semi-regular basis in the 9 months till then) down to approx 80-90MW. I thought this would be worth investigating further.
Change #2 occurs quite recently, from early June, where the output of the plant seems to have barely budged off 0MW. This change has understandably attracted some curiosity.
(B) What happened recently, with Change #2?
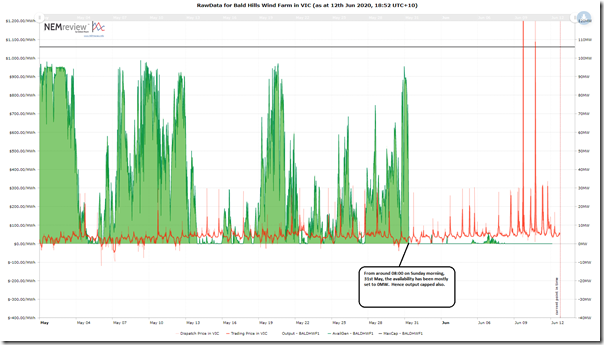
Here’s the same sort of NEMreview trend zoomed in to just look at the past few weeks (query here):
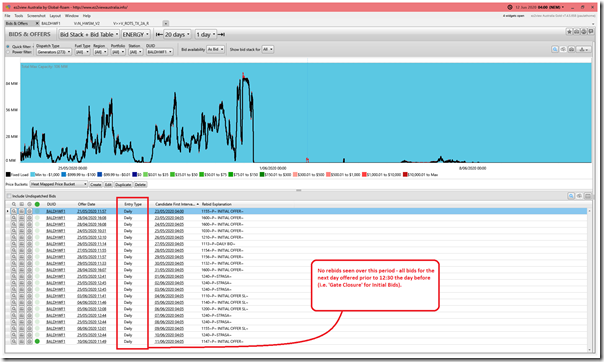
Here we see that the marked change in output pattern began on the morning of Sunday 31st May 2020, around 08:00 – so a little under 2 weeks ago. Pulling up the ‘Bids & Offers’ widget from ez2view focused on the past 20 days just for BALDHWF1 we see that the plant has consistently been bid down at –$1,000/MWh (i.e. the Market Price Floor) over this entire time range:
A couple observations about the bids that some readers might find of interest:
Observation #1) I’ve scanned the bids in the list and it seemed, on quick scan, that they were essentially identical in terms of both:
1a) 106MW offered at the Bid Band 0 (i.e. –$1,000/MWh); and
1b) Max Availability in the bid set to be 106MW.
… which for a Scheduled plant would be enough to set the volume used in NEMDE.
Observation #2) It would seem that the Registered Participant for the asset (which in this case is Alinta Energy Retail Sales Pty Ltd) is bidding the plant commercially so it should run as much as it is able.
Observation #3) However for Semi-Scheduled plant Availability in the Bid is over-written by the Availability that comes out of the AWEFS. This in turn uses either of the following:
3a) If there is no Semi-Dispatch Cap in place, then the plant runs unconstrained (and not dispatched down on price). In this case, Availability for the next dispatch interval is mostly set on persistence (i.e. based on what its output currently is). This is what was happening over much of this period.
3b) It’s only when the SDC flag is on that AWEFS uses ‘# turbines in service’ and wind speed to determine a ‘what would otherwise have been‘ forecast of energy-constrained availability. However this was not the case most of the time the output was down.
Question #4) So we’re really none the wiser about why the plant has not been outputting:
4a) Was the wind not blowing much of this whole time? This seems unlikely, but I have not checked.
4b) Did the Registered Participant leave the capacity offered in the bid at the same time as the plant had some technical (or other) reason why it could not produce, rather changing parameters in the SCADA link through to AWEFS (like Local Limit SCADA signal, or # turbines in service – i.e. data not visible in the MMS) following guidance given to them by AEMO?
Observation #5) The fact that the inner workings of AWEFS and ASEFS (i.e. in terms of the data input, such as ‘# turbines in service’) is currently impenetrable to us and others seems to be something that will need to be improving in terms of general market transparency and understandability as we move into NEM 2.0 (and, when I get the chance, will have more thoughts to share about what this means in terms of the Two-Sided Market concepts broadly outlined before).
Clarifications on Monday 15th June 2020
What was 3 Observations above has been expanded to 5 Observations/Questions on the basis of feedback/corrections from a knowledgeable reader. Thanks for that!
(C) Very briefly at Change #1
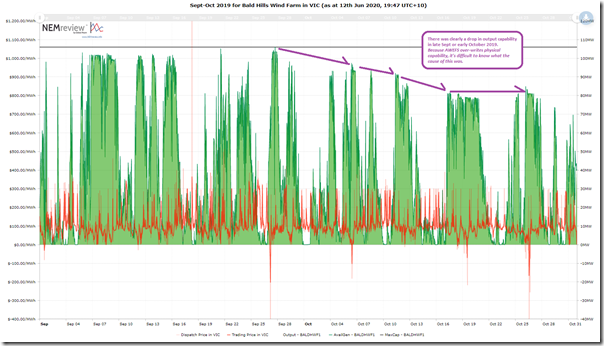
Don’t have time to do more than post (query here) the raw data trend here:
Because we can see that Availability dropped also, we know that (notwithstanding the caveats noted by Marcelle here where constraints can sometimes have the effect of reducing availability as well) it’s most likely that the reduction in output is due to either, or both:
Possibility 1) Some physical plant limitation onsite, or a commercial restriction that means the Registered Generator does not want to make full capacity available; or
Possibility 2) Some deterioration in environmental conditions leading to less wind harvest capability.
Alas, no more time to dig this evening…
PS on Monday 15th June 2020
Looking back over the weekend, we see that the plant did commence operations around 22:00 on Saturday 13th June and ran fairly consistently up to 25MW or so since that time. Still does not make it any clearer what went on over the intervening 2-week period.


Hi Paul,
Maybe this might have something to do with it?
“Neighbours take Bald Hills wind farm to court over health complaints” on 18th Feb 2020 in the Australian
“Victoria wind farm headed to court to fight claims of wind turbine syndrome” on 18th Feb 2020 in RenewEconomy
Could the wind speed be too high for the safe operation of wind turbines in this area?