Oh, and (before being distracted by Liddell) I was thinking about exploring a little more about what I noticed yesterday Wednesday) evening about the high level of NEM-wide demand forecast for Friday evening – as per my tweet yesterday:
might need to hold onto our hats on Friday, with @AEMO_Media forecasting NEM-wide demand above 34,000MW. Will try to have a look via https://t.co/wqkMv8bY4Q tomorrow… pic.twitter.com/sQLx9VsbqE
— Paul McArdle (@4paulmcardle) January 29, 2020
It’s been years since we gave away a BBQ to the ‘best demand forecaster in the NEM’, but that has not diminished our interest in peak demand in any way.
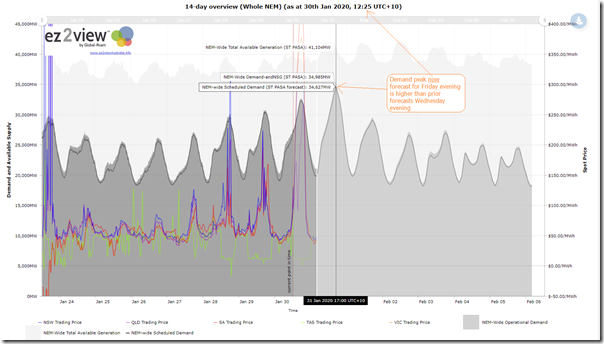
The image in my tweet yesterday showed that the AEMO forecast for Scheduled Demand was that it might be 34,174MW in the half-hour ending 17:00 (NEM-time), and that an approximation of Operational Demand might be 34,628MW.
For the gory details about the differences between Scheduled Demand and Operational Demand (and other measures) see here.
As it is, I now don’t have much time, so will make this brief. Perhaps tomorrow I can come back to have more of a look as it unfolds…
(A) Tracking demand
First thing to emphasise is that these forecasts from the AEMO are subject to change, as the AEMO’s expectations for the weather changes (along with other factors). For instance in the AEMO forecasts relevant at 12:25 (i.e. just before ‘gate closure’ and when P30 predispatch rolls out into the coming day) we see below that the forecast peak in demand for tomorrow evening is now expected to be even higher, at 34,627MW on a Scheduled Demand basis:
Yikes!
For those with a licence to ez2view, you can track the evolution of this trend with your copy here.
(B) Comparison with prior levels
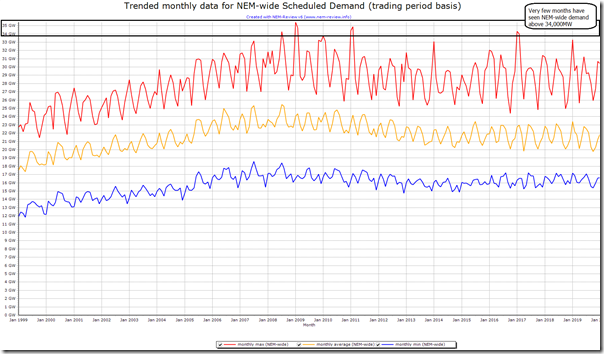
Quickly opening up NEMreview (v6 for a change) I’ve trended the minimum, average and maximum demand levels (NEM-wide Scheduled Demand) since the start of the NEM:
We can see how rare it has been that the NEM-wide demand rises above the 34,000MW barrier! Three years since the last excursion into that lofty territory.
(C) Region-by-Region breakdown
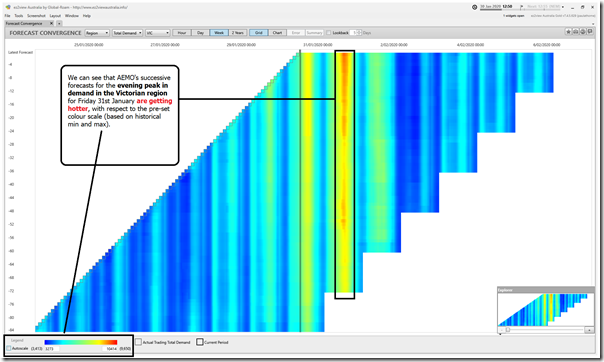
If I had more time, I would break down the forecast by region and analyse in detail. However all I have time for today is to throw in this ‘Forecast Convergence’ view from ez2view showing that AEMO’s successive forecasts for evening peak demand in the Victorian region are becoming progressively ‘hotter’:
This could be due to a combination of factors, including:
Factor 1 = increased temperatures forecast, driving higher demand forecast; and
Factor 2 = reduced forecast for ‘behind the meter’ energy production netting off ‘Native Consumption’ (though it’s probably too early for any form of reliable forecast of rooftop PV injections more than 24 hours away, so this factor seems less likely so far out).
(D) What actually unfolds on Friday
…. will need to wait for another article tomorrow, time permitting!
—————-
PS1 at 13:02 Thursday
Just after I’d published this, AEMO issued an LOR2 (Low Reserve Condition) notice which says the following
________________________________________________________________________________________________
Notice ID 73091
Notice Type ID LRC/LOR1/LOR2/LOR3
Notice Type Description MARKET
Issue Date Thursday, 30 January 2020
External Reference PDPASA – Forecast Lack Of Reserve Level 2 (LOR2) in the Vic Region on 31/01/2020
________________________________________________________________________________________________
AEMO ELECTRICITY MARKET NOTICE
AEMO declares a Forecast LOR2 condition under clause 4.8.4(b) of the National Electricity Rules for the Vic region for the following period:
From 1530 hrs 31/01/2020 to 1700 hrs 31/01/2020.
The forecast capacity reserve requirement is 916 MW.
The minimum capacity reserve available is 852 MW.
AEMO is seeking a market response.
AEMO has not yet estimated the latest time at which it would need to intervene through an AEMO intervention event.
Manager NEM Real Time Operations
Will really need to wait to see what unfolds tomorrow!


Leave a comment