On Tuesday we saw the good news that Loy Yang A2 had returned to service, albeit a few days later than initially planned.
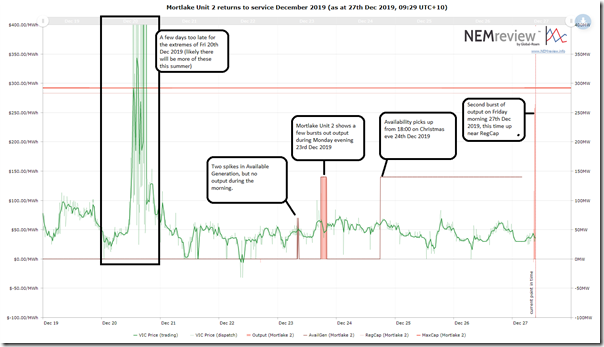
To round out the Christmas week, this morning (Friday 27th December) we noticed that Origin Energy’s Mortlake 2 unit back to service and up close to full load – a few days earlier than their most recently announced 30th December return date (though I do have a vague memory there was initially talk of that also being around 20th December). Mortlake had been out of service since 8th July 2019.
(A) Mortlake starts back up
Using this trend in NEMreview v7, we see now that Mortlake 2 had actually shown a burst of output on the Monday evening 23rd December:
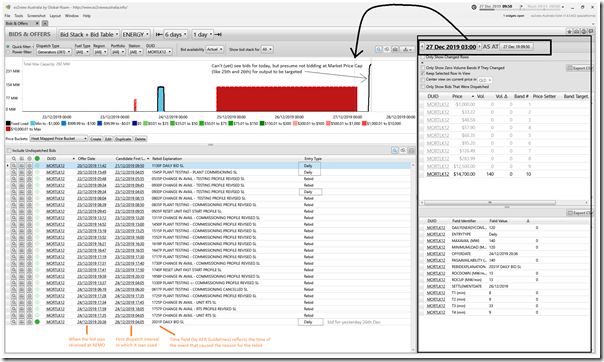
Out of curiosity, I pulled up the ‘Bids & Offers’ Widget in installed ez2view to focus specifically on the trend in bids (and particularly rebids) for Mortlake 2 over recent days:
Unsurprisingly (as returns-to-service are complex processes after what would have been a complex repair process) we see numerous rebids over the period since the first bid shown for last Friday 20th December (i.e. prior to first operations).
For those interested in the automated categorisation of rebid reasons, with respect to AER Rebidding Guidelines, as part of our Generator Report Card 2018 (and which we are expanding as a comprehensive cataloguing of every rebid for every unit through CAL2019 in the Generator Statistical Digest 2019) we see see that all of these rebids are of consistent form and are categorised as ‘Well Formed (Loose)’ or ‘Not Well Formed (Strict)’ because of the lack of space between HHMM and Category.
(B) Mortlake stats through CAL 2019
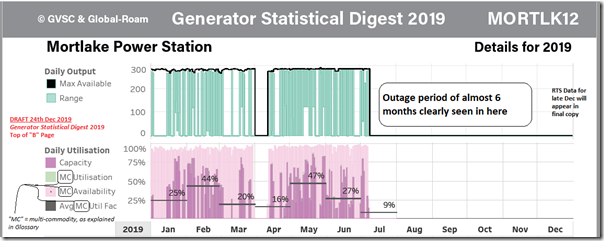
Coincidentally, whilst we watch Mortlake Unit 2 restart this morning we are also reviewing Tuesday’s draft of our (nearly completed!) Generator Statistical Digest 2019. In the past couple weeks whilst we have been working through these drafts, I have found this particular summary trend a very useful quick-reference guide to the type of operations that each unit has experienced through Calendar 2019:
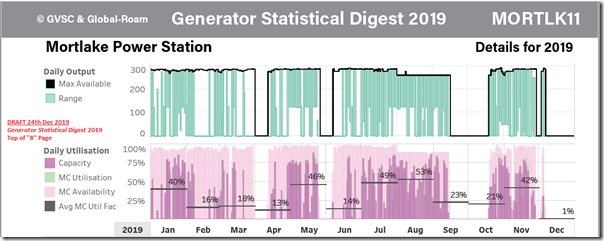
I can see here that (prior to the 6-month outage period) some months saw capacity factors in the 40% range, which was higher than I had been assuming in my mental model for the plant (and reinforces the value of having access to ready-reference stats like these). Because I had it open, here’s the same stats for Mortlake Unit 1:
We have a clear sense that we’ll be finding much value in referring back to stats pages like these through the whole of 2020, and are keenly awaiting the release of the Generator Statistical Digest 2019 in about 2 weeks…
(C) Victorian outlook for coming weeks and months…
Now that both Loy Yang A2 and Mortlake 2 have returned to service, I thought it might be useful to provide these two views of the future ahead (according to AEMO’s ‘base case’ forecasts in ST PASA and MT PASA) this summer/Q1:
(C1) The week-ahead view into ST PASA
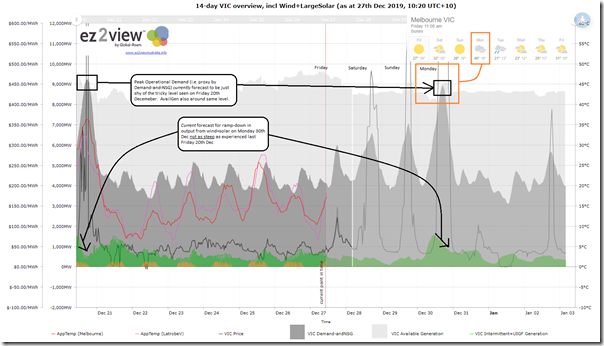
Using this trend view in ez2view online, we can clearly see that Monday next week (30th December 2019) is forecast to be the stand-out in the week ahead:
Currently (as at 10:20 today) the peak level for Operational Demand is forecast to be up just shy of the level experienced last Friday 20th December where we saw some remarkable conditions emerge (discussed here on Saturday, on Monday, and here on Tuesday (thanks Allan)). I also note that the forecast currently for Monday is for cloudy conditions, which might also dampen injections from solar PV (both grid-scale and rooftop) – another reminder of what we discussed in the Generator Report Card 2018:
Following from this remarkable Market Notice on Monday evening (thanks to those who have relayed the message to Wind and Solar Farm operators via various channels!) we also saw this morning Market Notice 72088 reminding us of extreme conditions forecast for Victoria (Monday 30th) and NSW (Tuesday 31st):
——————————————————————-
MARKET NOTICE
——————————————————————-
From : AEMO
To : NEMITWEB1
Creation Date : 27/12/2019 10:06:05
——————————————————————-
Notice ID : 72088
Notice Type ID : GENERAL NOTICE
Notice Type Description : Subjects not covered in specific notices
Issue Date : 27/12/2019
External Reference : Market reporting for forecast extreme temperature in the New South Wales region on 31/12/2019 and Victoria region on 30/12/2019 and elevated temperatures in South Australia region
——————————————————————-
Reason :
AEMO ELECTRICITY MARKET NOTICE
AEMO’s weather service provider has issued forecast temperatures for New South Wales (NSW) region and Victoria (VIC) region that are equal to or greater than the Generation Capacity Reference Temperatures:
NSW
On 31/12/2019: Maximum forecast temperature 43degrees C at Bankstown for the Sydney area.
VIC
On 30/12/2019: Maximum forecast temperature 42degrees C at Melbourne for the Melbourne area.
Also, note that elevated temperatures are forecast in South Australia region from 27/12/2019 to 30/12/2019.
Further updates to this advice may not be provided.
AEMO requests Market Participants to:
1. review the weather forecast in the local area where their generating plants are located and,
2. if required, update the generation levels in their dispatch offers consistent with the forecast temperatures.
Details on Generation Capacity Reference Temperatures can be accessed using the following link to AEMO website:
http://www.aemo.com.au/Electricity/Planning/Related-Information/Generation-Information
Generation Capacity Reference Temperatures:
QUEENSLAND – BRISBANE AREA 37 degrees C.
NEW SOUTH WALES – SYDNEY AREA 42 degrees C.
VICTORIA – MELBOURNE AREA 41 degrees C.
SOUTH AUSTRALIA – ADELAIDE AREA 43 degrees C.
TASMANIA – GEORGE TOWN 30 degrees C.
BASSLINK- (Latrobe Valley Airport 43 degrees C AND GEORGE TOWN 33 degrees C)
Harmohan Singh
AEMO Operations
——————————————————————-
END OF REPORT
——————————————————————-
We’ll have to wait to see what unfolds….
(C2) The quarter-ahead view into MT PASA
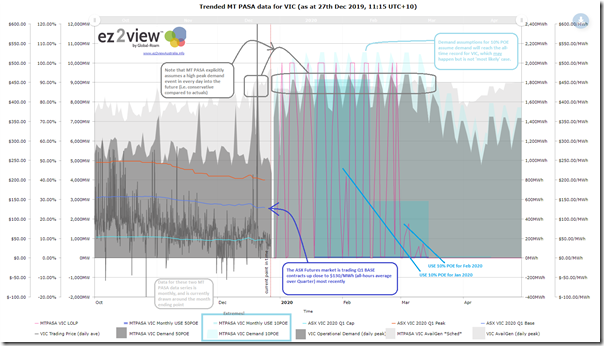
Using this different trend view in ez2view online, we can clearly what the AEMO (combined with ASX Energy prices for standard contracts for Q1 2020 in VIC) is saying for the quarter ahead:
The short synopsis of all of this information for Q1 2020 is that “it will be tight!”, at times (i.e. when temperatures are extreme).
However I have hoped, by showing some historical data in context to the MT PASA forecasts for Available Generation (scheduled only) and Demand (hot day peak demand forecast only) to help the reader understand the conservatism naturally (and understandably) built into the process, given its primary purpose.
Given this, it’s not really a surprise to see both:
(a) Many days forecast where LOLP (Loss of Load Probability) is above 0%; and
(b) Non-zero monthly Unserved Energy (in MWh) in January and February 2020, especially under the 10% POE (Probability of Exceedance) demand case, which assumes that the demand will peak slightly above to the all-time record for Victoria (i.e. 10,496MW on a Scheduled Demand basis).
Given demand last Friday was above 9,000MW leading into Christmas, and is forecast to be around 9,000MW again on Monday next week and we’re forecasted to have a long hot and dry summer, it’s clear that this is a plausible scenario – though not ‘most likely’.
Hence, it is not really a surprise to see that the Base Load Futures Contract for VIC Q1 2020 was most recently trading just below $130/MWh (all hours for the quarter) and peak at exactly $200/MWh and caps at just under $50 – but again compare with where the daily average spot trended for Q4.



Leave a comment