The transition that the NEM is undergoing has been described by others as moving from a “Baseload and Peaking” plant mix to one which could be described as “Intermittency and Flexibility”. On WattClarity we previously posted about “The death of ‘baseload’ and the rise of ‘cycling’” whilst we were developing our Generator Report Card.
This transition is unavoidable (and might be accelerating) – what’s of more interest to us is whether it’s being managed well, or not so well.
As noted before (e.g. this prognosis of a train-wreck) there is much evidence to suggest that we could be doing this much better than we are currently – indeed, we invested considerable time in the Generator Report Card investigating a number of different ways in which we’re not doing as well as we should.
(A) More flexibility required in future
With an increasing volume of energy being supplied on some occasions by intermittent (wind and solar) plant primarily bidding currently* at $0/MWh or below, other dispatchable plant will be required to provide the balance between this intermittent supply and demand at all times. It seems certain that flexibility will be of increasing value into the future.
* readers need to remember that there is nothing that mandates that solar and wind generators bid at or below $0/MWh – or indeed at any particular price:
(i) That bid prices don’t need to reflect costs (i.e. under the rules) is one of the central tenets of our market design (as discussed here as an introduction to this beginner’s guide to how dispatch works in the NEM);
(ii) If solar and wind generators see collectively start receiving less revenue (spot + contract) than they need to survive (arising from increased incidence of negative prices due, in part, to a significant lack of diversity), it seems logical that bid prices might be one thing that could change.
(A1) Capacity mix providing this flexibility
Eventually this flexibility will be supplied by a plant mix that has been specifically built for this purpose.
However for a transitional* period the current fleet of dispatchable capacity (mostly thermal) will play a large role in supplying these new services. There are:
- 48 coal-fired units still operational in the NEM,
- a larger number of gas-fired units (typically running lower capacity factor),
- a few liquid-fired peaking plant;
- some hydro; and
- a small but growing number of scheduled battery storage facilities.
All of this capacity will be required to operate more flexibly into the future as the volume of installed capacity of wind and solar increases. Hence investments by their owners to make legacy assets more flexible, and hence more fit-for-future-purpose, are of particular interest to us.
* this transitional period might last 2 decades or more till all 48 remaining coal-fired units are closed. This is obviously much longer than a sizeable number of people would wish for, given concerns about the global carbon budget and Australia’s contributions to that.
(A2) Two measures of “flexibility”?
In the Generator Report Card (from page 47 in Part 4) we specifically focused on the coal units (i.e. rather than other fuel types) with respect to flexibility, given both:
(i) coal still supplies the dominant* share of “grid energy” in the NEM;
(ii) some misunderstanding amongst the broader group of energy sector stakeholders – a number of whom perceive these coal units as being incapable of flexibility.
* We noted in the Generator Report Card how the 48 currently operational coal units remaining in the NEM supplied roughly 75% of total “grid energy” supplied by all plant registered with, and visible to, the AEMO through calendar 2018.
In particular, we focused on two key measures:
Measure #1 = the ramp rate of the unit (i.e. how quickly it can change output – up and down); and
Measure #2 = the minimum load of the unit (i.e. the lowest output the unit can manage).
We describe in more detail within the Report Card why these measures are not as simple as they might initially appear. Central to understanding this complexity is to understand that both parameters are perhaps more commercial parameters (in terms of how they are used in the market) than technical ones.
Readers will also be interested in this approach taken by Allan O’Neil recently to estimating what the minimum levels of operation are for coal units across the NEM.
(B) An interesting example from last week (Stanwell unit 1)
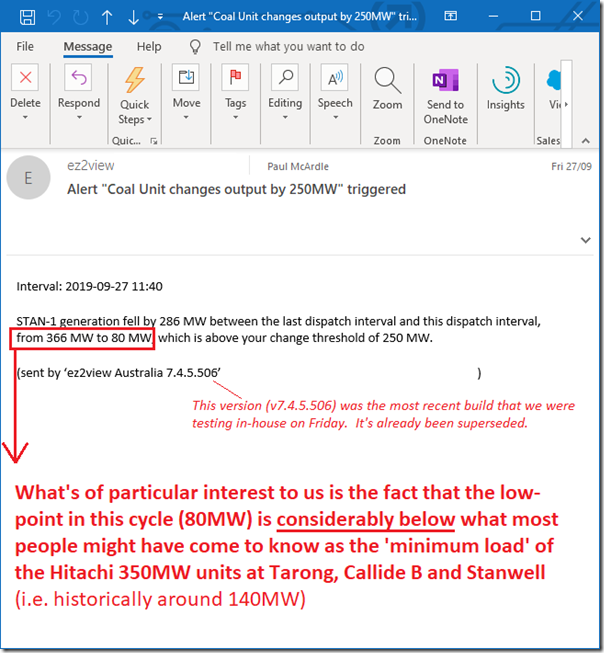
My copy of our ez2view higher-end dashboard triggered an email alert to me on Friday last week noting about an interesting development at Stanwell Unit 1:
As noted in the alert, in the 11:40 dispatch interval on Friday the InitialMW recorded an output of only* 80MW, which was down from 366MW only 5 minutes before that.
* as I’ve noted on the image, the reason why 80MW is significant is because it’s 60MW (i.e. 40%) lower than the 140MW level (with the 140MW level being what many have come to know as the ‘minimum load’ of the 10 x 350MW Hitachi units installed at the Tarong, Callide B and Stanwell stations).
* also worth noting is the speed of the decline.
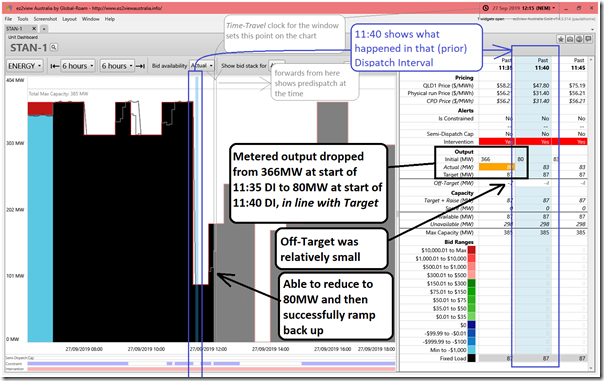
Given that our new “Unit Dashboard Widget” is under intensive development currently, I was keen to see what was visible of this event in this new widget – so here is a slightly newer version (v7.4.5.514) of the software Time-Traveled back to 12:15 back on Friday 27th September (i.e. where we can subsequently see more of what happened than we could on Friday, when some data was still confidential):
[CLICK ON THE IMAGE FOR A LARGER VIEW]
We can see that the unit was successful in dropping load as it had planned to do from 366MW down to 80MW – hence triggering the orange colour-coded “large change” alerting built into the widget. Furthermore we see that the unit then both:
(i) held stably at that low level for a half-hour period;
(ii) before ramping back upwards again.
We can also see in the chart that the unit had planned to trip a little later on that day and then start back up again (all part of the commissioning process it is undergoing currently).
This example highlights an important point – whilst we could take a duration curve approach (like Allan’s approach) to estimate “minimum generation levels” it’s important to understand that these will likely deliver us a view of the lowest level of operation the market is currently requiring these plant to deliver. This can be useful in many ways (such as in the analysis Allan completed) but it should not be confused with a technical minimum load imposed by plant characteristics.
Broadly speaking:
1) the fleet of 48x operational coal units are more flexible than some people might have been led to believe through commentary seen elsewhere;
2) what we currently see, in terms of the range of operation, is determined as much by current market dynamics than hard technical limitations – notwithstanding that there may be additional costs attributable to cycling (heat rate degradation, and more remnant life usage);
3) given they are confronted with the inevitable threats (and opportunities) of this energy transition, it seems natural that the operators of these coal units will be investigating how they might make their fleet more flexible at lower cost/risk for the future, and hence be ready to capture the increased value the market will attribute for flexibility moving forwards…
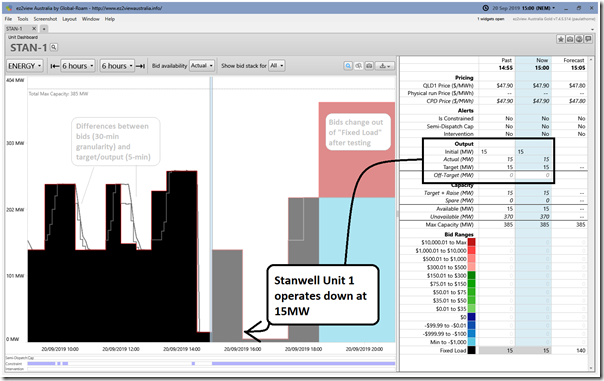
As a further illustration of this trend, we Time-Travel the same widget in ez2view back another week (to Friday 20th September) and we see this instance with Unit 1 successfully stepping down to run at a load of only 15MW:
(i) this is enough power generated to only cover the auxiliary energy requirements of the unit itself;
(ii) capability like this “reduce to house load” is necessary for some units on the grid to support system restoration efforts in the event of some major grid disturbance (i.e. make it possible to restart the grid more quickly than would otherwise be the case);
(iii) technically there would be presumably some different furnace firing techniques being used to support this, but these are a layer beyond the overall message in this article.
Readers should not misinterpret the meaning in this article – I’m not saying that Stanwell Corporation (or any coal unit operator) might want to operate with a cyclic profile shown in these images – just that experiences like these demonstrate that the coal units can be more flexible than a sizeable percentage of energy sector stakeholders might have otherwise believed.
It seems likely that the market will be valuing flexibility more highly in future…
——
Finally, it’s worth noting for those interested in the ez2view development above that the prices shown in the “Unit Dashboard Widget” include, in addition to the simple dispatch price for the QLD region, both:
- the Price derived by AEMO in the physical run of an Intervention period (which did apply at 11:40 as shown above); and
- that Physical Run Price adjusted by the effect of any constraints bound on that particular DUID (noting they did not apply at 11:40 as shown above) – hence giving a DUID-specific physical dispatch price at the Regional Reference Node.
Give us a call (+61 7 3368 4064) if you’d like to understand how these data points would be useful for your assets?


Leave a comment