Two large thermal generating units in Victoria with combined capacity of over 800 MW have recently experienced major electrical faults each requiring many months to repair. Previous WattClarity posts have covered initial assessments of the outages of AGL’s 530 MW Loy Yang A unit 2 (followed up here), and at Origin’s 283 MW Mortlake unit 2. Announced return-to-service dates for both units fall in December, but with extensive and complex repairs required, there are inevitable risks of slippage in these targets. The affected units provide about 7% of Victorian large-scale generating capacity and nearly 9% of the state’s dispatchable capacity, so there are valid concerns about impacts on supply reliability over summer 2019-20 given the already tight supply-demand balance and the load shedding required in Victoria last summer during two days of very high temperatures and generator failures.
In this post we’ll update some of the forward market data reflecting possible impacts on reliability and electricity prices, and compare Victoria’s position lacking these two units with the situation that transpired in January this year.
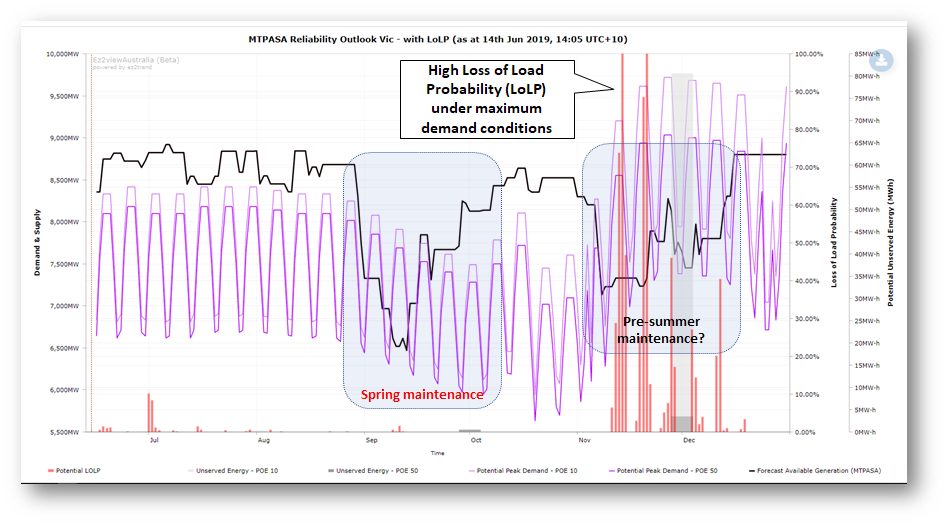
In the earlier post on projected impacts of the Loy Yang A2 outage I included the following chart drawn from AEMO’s MTPASA projections for supply-demand balance:
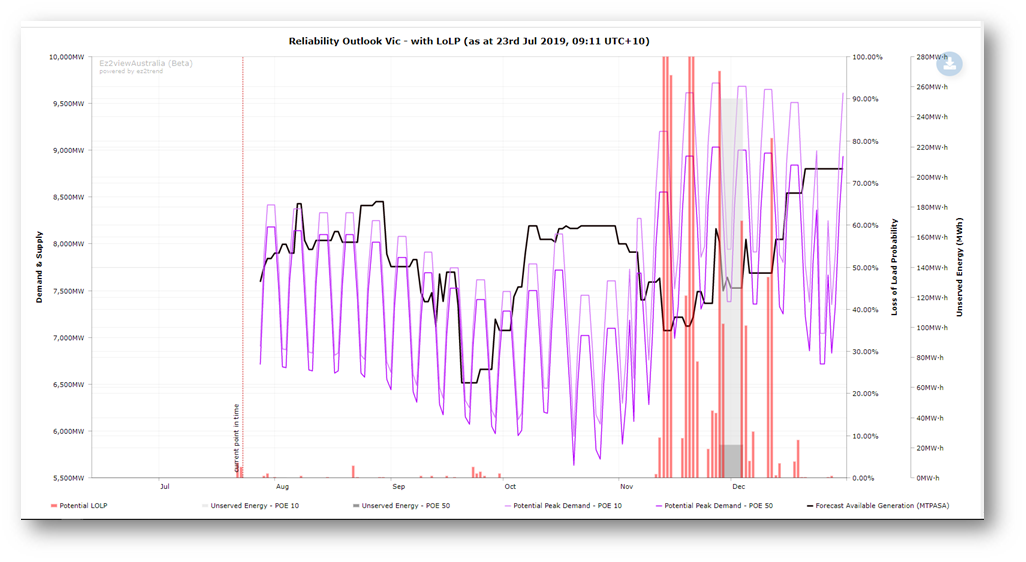
The corresponding current outlook is shown in the following chart, and a close comparison between the two shows increases in the assessed risk of load shedding (“Loss of Load Probability” or LoLP, as well as increases in possible Unserved Energy – the grey columns in the chart) in the mid-November to mid-December period, driven by the absence of Mortlake unit 2 until late December, overlying the LYA2 outage and previously scheduled pre-summer outages at other generators. The final step up seen in the black capacity line below is the target return to service date for Mortlake 2; it is less clear exactly when LYA2 is scheduled to return in this view (AEMO does not publish individual unit availability data, only aggregate regional levels):
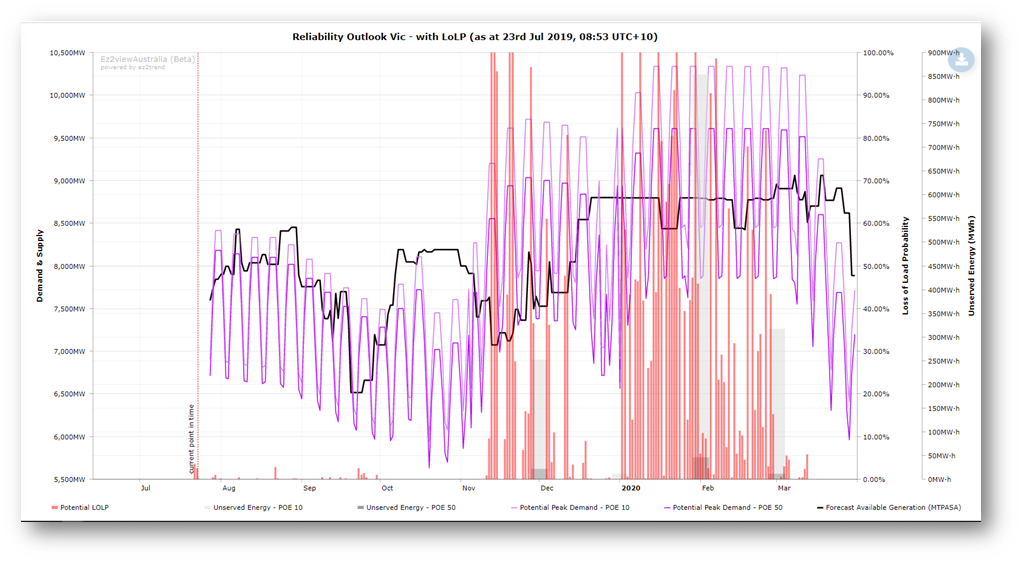
Extending the chart to include the January-March 2020 quarter, we see that even after the projected returns to service of the Loy Yang A and Mortlake units, significantly higher reliability risks appear in January and February 2020, driven by the higher potential maximum demands in the peak summer period:
In other words, mid-summer remains the key period of supply-demand tightness in the Victorian region, although the outages at Loy Yang A and Mortlake have increased the risks in the event of high temperatures and demands occurring in late November and December. Of course if the returns to service of either or both of these units were significantly delayed into January or February, then reliability risks in mid-summer would escalate substantially – I’ll return to this point later.
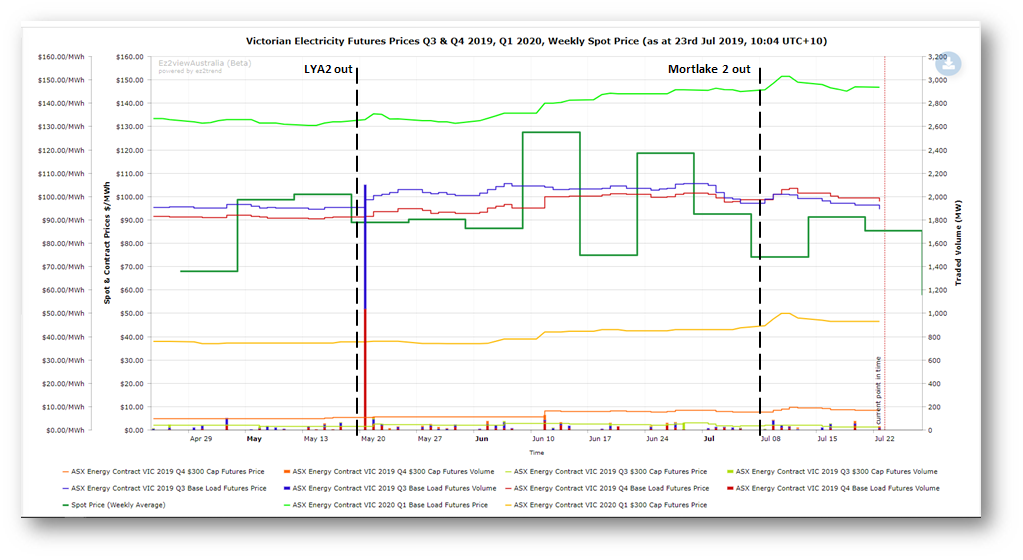
The charts above illustrate AEMO’s assessment of the physical supply-demand balance outlook; market participants’ views are in part captured by the dynamics of forward prices for electricity contracts over summer, summarised in the following price chart from ez2view:
Key takeouts from this chart are that:
- Baseload and cap contract prices for Q3 (July-September) 2019 initially showed some reaction to the outages but have essentially returned to their prior levels,
- Contract prices for Q4 2019 have increased by about $9-10/MWh (baseload) and $4-5/MWh (caps),
- Contract prices for Q1 2020 have increased by $10-$15/MWh, even though both damaged units are targeted for return to service prior to January,
- The lift in Q4 2019 and Q1 2020 prices largely preceded the outage at Mortlake – while there were short term jumps in prices for all contracts shown after information on the severity of the damage and repair time were disclosed, prices have largely retraced over the following two weeks
As a reference point for the forward price levels charted, Victorian spot prices for Q1 2019 averaged $165.8/MWh of which $51.1/MWh was associated with the “cap value” of spot prices in excess of $300/MWh. Most ($41/MWh) of this cap value arose over the two days of load-shedding experienced on the 24th and 25th of January, when spot prices reached the then-prevailing Market Price Cap of $14,500/MWh for several hours.
Q1 2020 Victorian forward prices for baseload contracts at close to $150/MWh and caps at close to $50/MWh could therefore be interpreted as a market consensus that supply-demand tightness next summer could lead to events similar to those seen in January this year. Consistent with AEMO’s assessment of lower and less extended risks to supply reliability in Q4 2019, forward prices for that quarter are significantly lower, despite the absence of LYA2 and Mortlake 2 for most of the quarter.
Concentrating on Q1 2020, it is possible that the recent increases in forward prices reflect a combination of market participants:
- fearing that the Loy Yang A and Mortlake outages will extend into the higher risk peak summer period, directly increasing the chance of load-shedding and extreme prices,
- focusing their attention more generally on the outlook for summer reliability and the chance of plant outages, even if repairs at Loy Yang A and Mortlake are completed on target
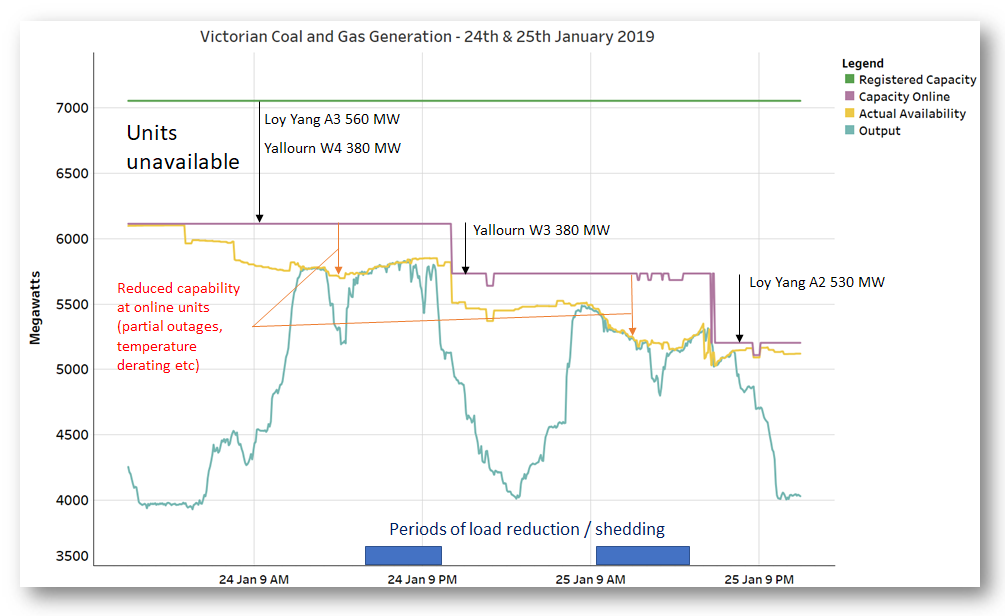
There isn’t space in this post for a deep analysis of the events of last summer, in particular January 24-25 in Victoria (see AEMO’s very detailed report), but I thought it would be useful to close with a chart summarising performance of the Victorian thermal generation fleet (coal and gas-fired units) over those two days of very high temperatures and demand, just to put into perspective the size of the outages under discussion in this article:
This chart shows that on the first day of load reduction / shedding, when temperatures peaked at over 47 degrees in Adelaide and 41 in Melbourne, two large thermal units with combined capacity of 940 MW were unavailable due to repair work, and there were further capacity deratings of around 400 MW at units online. By 25th January when Melbourne reached 43 degrees (46 in some suburbs) a further coal fired unit had gone offline and larger deratings were experienced across the remaining coal and gas fleet. A fourth large unit failed later on 25th January but this happened after a cool change had lowered demand and load-shedding had ended.
While there has been new renewable capacity commissioned in Victoria and South Australia since last summer and more is in the pipeline, this may contribute little additional supply at a time of peak demand stress. The only new dispatchable capacity which may be online is at AGL’s Barker Inlet station in South Australia (up to ~200 MW in late 2019 or early 2020).
Were similarly extreme temperature and demand conditions to recur this coming summer and repairs at Loy Yang A2 and Mortlake 2 had not been completed, then supply-demand balance could be broadly similar to that seen on 24 January. Of course if other thermal units failed, supply would be lower, whereas if better wind conditions prevailed (unlike January 24th when wind strength fell away over the evening peak), supply-demand balance would improve.
Given the importance of having maximum levels of dispatchable capacity available to meet extreme summer demands in Victoria and South Australia, should these eventuate, the progress of repairs and likely return to service dates for Loy Yang A unit 2 and Mortlake unit 2 will remain of critical interest to everyone involved in or affected by the market. We’ll continue to monitor developments here on WattClarity.
——————————————-
About our Guest Author
 |
Allan O’Neil has worked in Australia’s wholesale energy markets since their creation in the mid-1990’s, in trading, risk management, forecasting and analytical roles with major NEM electricity and gas retail and generation companies.
He is now an independent energy markets consultant, working with clients on projects across a spectrum of wholesale, retail, electricity and gas issues. You can view Allan’s LinkedIn profile here. Allan will be sporadically reviewing market events here on WattClarity Allan has also begun providing an on-site educational service covering how spot prices are set in the NEM, and other important aspects of the physical electricity market – further details here. |


Leave a comment