I really have to get back to the more longer-term analysis that’s central to the Generator Report Card 2018, but could not do so until taking a look at bids that are now visible for what 5 particular generators did during the 14:30 trading period yesterday.
Note that on of our valued guest authors, Allan O’Neil is (time permitting) going to have more of a detailed look at a range of different events that we’ve collectively collated about what happened yesterday – so stay tuned for that on WattClarity sometime next week, I hope.
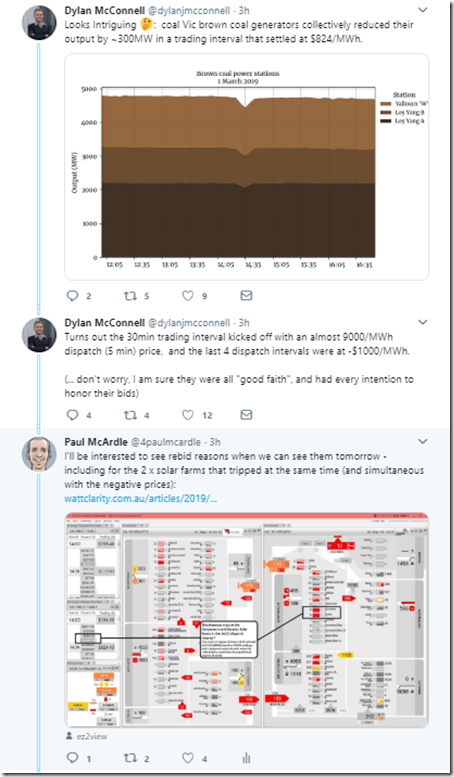
For now, I just want to dig into two separate/related questions posed (one by me in yesterday’s article, and one by Dylan McConnell) – both of which relate to reaction to the negative dispatch prices in the 14:30 trading period, and which are both summed up in this exchange on Twitter:
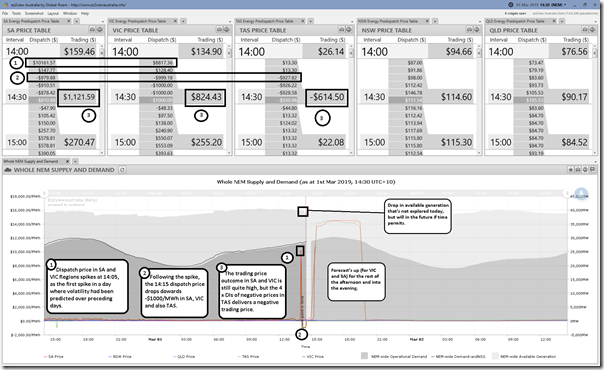
For some initial context, here’s a line-up of Region Prices for the trading period ending 14:30 on Friday 1st March – via Time-Travel in ez2view:
The dispatch price spiked at 14:05 and then dropped through the floor at 14:15 (remaining there for the next 4 dispatch intervals). This still delivered a significant trading price for VIC and SA, though it was negative in TAS.
1) Taking a brief look at what happened with 5 x Power Stations
We’ll briefly look at the 5 x Power Stations referenced in the tweet above (I mentioned Karadoc SF and Gannawarra SF, whilst Dylan mentioned Loy Yang A, Loy Yang B and Yallourn stations):
(A) Karadoc Solar Farm
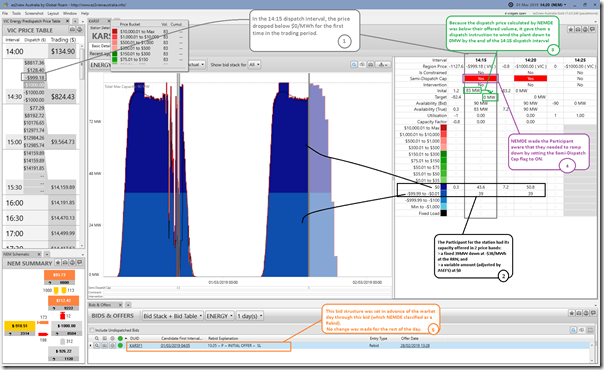
Here’s another view compiled from a couple widgets inside of ez2view with “now” of Time-Travel set to the 14:20 dispatch interval so we can see a bit of context:
The ability to (today) access bid data for yesterday provides confirmation that Karadoc SF ramping down to 0MW was just the participant following a dispatch target to do so, given that it’s energy was offered at a more expensive price to the –$999.18/MWh dispatch price at 14:15.
A totally understandable approach – one example of how a Semi-Scheduled solar farm might limit their exposure to low negative prices without being too active in the market.
However it should be noted that this passive approach represented a lost revenue opportunity of approximately $14,500 just in 20 minutes (i.e. 84MW x 20 min x $824.43/MWh for the trading price)!
(B) Gannawarra Solar Farm
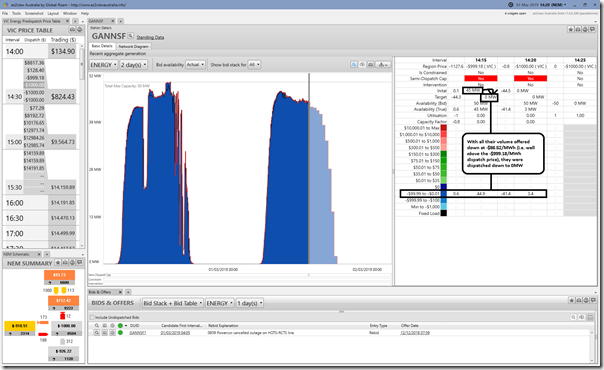
Here’s the analogous view for Gannawarra Solar Farm, without so many annotations:
Again in this case, the plant had volume offered above the dispatch price, so it is no surprise that they were dispatched down to 0MW via the Semi-Dispatch Cap.
Like Karadoc, however, this also represented a lost revenue opportunity ($12,360 approx) given the trading price still ended up at $824.43/MWh
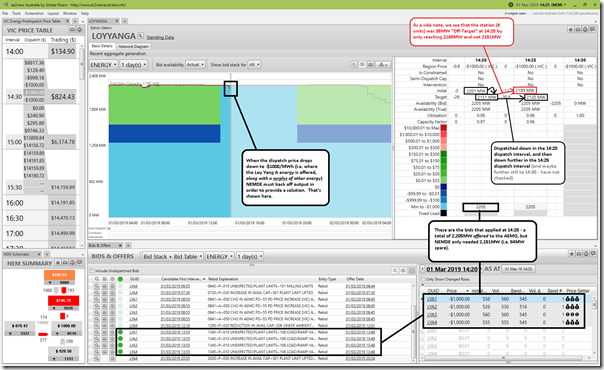
(C) Loy Yang A Power Station
Loy Yang A was on the bottom of Dylan’s chart, and shows a drop in output that seems to be in this 14:30 trading period, so we take a quick look here with “now” in Time Travel focused on 14:25:
The bid structure here is busier than for a Semi-Scheduled plant, and it was managed more actively than the two solar farms (being fully Scheduled, that’s almost guaranteed). However the underlying story is similar:
(i) In this case, all volume offered down at –$1,000/MWh
(ii) Hence not dispatched down as much (and only from 14:20 at dispatch price of –$1,000/MWh because of all the other capacity also “parked” at the Market Price Floor in the bids).
(iii) Hence they minimised their risk of “lost revenue opportunity” in trading periods like this one.
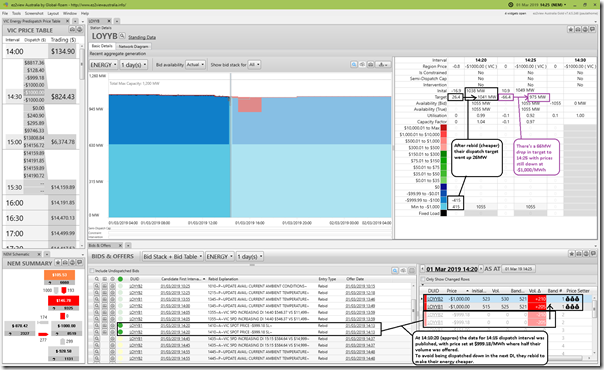
(D) Loy Yang B Power Station
Next up the list was Loy Yang B with the story is similar – though also unique in its own way:
In this case, Loy Yang B was facing a “lost revenue opportunity” much larger than those actually incurred above by Karadoc SF and Gannawarra SF – because it had about half of its volume not all the way down at –$1,000/MWh (but instead at –$999.18/MWh: no time to investigate why).
Given that this was where the price landed for 14:15 and the 2 units each set the price (that’s a “Simple” case of Price Setter in Category 2 here), I’d be guessing* the traders were concerned they would “lose” 415MW of output for 14:20, 14:25 and 14:30 – with the trading price guaranteed to be at least +$826/MWh
* Note that the rebid reason, which you can see in the image above, references the price achieved, but does not explicitly talk about motivation. That’s not unusual (and, as noted before, guessing at motivations is a core pass-time for NEM analysts).
In order to minimise the lost revenue opportunity, then, they shifted their volume down to –$1,000/MWh, thereby saving themselves “lost revenue” that might have been up to $85,700! A case study in active management.
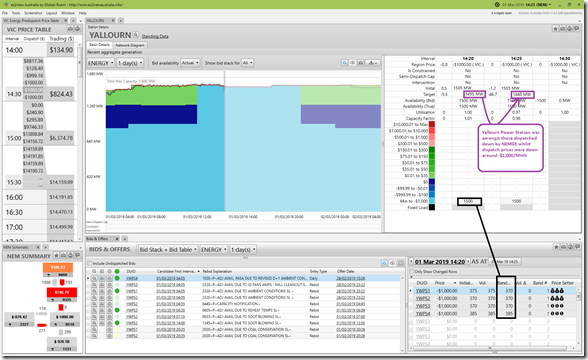
(E) Yallourn Power Station
Finally we look at Yallourn and see that they had all 4 x units running with volumed offered down at –$1,000/MWh. These were dispatched down as a result of the dispatch price hitting the Market Price Floor for 3 x dispatch intervals.
In this case, we see the operator had rebid a few times through the day – but this appears to be for plant related reasons and not related to the volatility through the day.
2) Difference between the conclusions today and inferences yesterday.
As I’ve noted before, the NEM is a complicated beast.
In this case it seemed that both Dylan and I saw an incomplete data set on Friday and our “Subconscious Inference Engines”started down the wrong paths.
1) For me, buried in the detailed analysis of all NEM power stations across up to 20 years of history (and with one particular focus being understanding patterns in units being “Off-Target”) I saw the reduction to 0MW and immediately jumped to “trip”. A trap I’ll try not to fall into next time!
2) For Dylan, who appears integrally involved in the “#coalfail” publicity campaign, it seems a drop in output at some coal-fired stations might have automatically started the warning bells about something going awry there.
Alas in both cases what we see above is much more “normal”. In the case of the reactions at Karadoc SF, Gannawarra SF, Loy Yang A, Loy Yang B and Yallourn, the reductions in output at all 5 stations appear nothing more than what each generator’s stated intentions (via their bid profiles) would suggest.
Now we just have to wait for Allan to fill in the broader picture of what happened on Friday with his post next week (and I really have to try to avoid these interesting distractions and get back to the Generator Report Card 2018)…


I hear you about the market complexity vs physics argument (twitter chat) but those extreme prices don’t seem to be triggering investment decisions. I suppose the RET has somewhat superseded price signals…