Summer’s formally begun 11 days ago – and yet it surprises me to note that this is the first post on WattClarity formally about summer 2018-19. We’ve been too busy in a couple of areas:
1) onboarding a bow wave of new clients (and in some cases providing detailed training about our software and the broader market);
2) compilation of data sets for what might be over 100 metrics for generator performance (on a station-by-station basis) for consideration in our Generator Report Card 2018; and
3) some other initiatives to assist new entrants to the energy sector (that are currently flying under the radar)
– though we have noted a couple market observations on Twitter and LinkedIn.
A conversation this week has prompted me to take a quick look at what’s currently forecast for the Queensland region over the coming summer/Q1 period – and we will (as in prior years) try to ensure we post quick analysis of interesting events as they occur.
(A) Forecast for QLD, using AEMO data
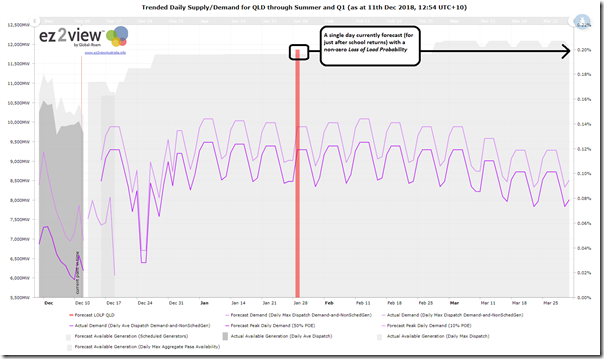
Using the web-based Trend Engine within the ez2view software, I’ve put together a mash-up of actual supply/demand data plus AEMO’s forecasts from ST PASA and MT PASA out till 31st March 2019. This currently looks as follows:
Licensed users of ez2view can access a copy of this trend here, and then continue to develop their own analysis.
Of interest is the single day forecast for the day that schools are back in January where there is a non-zero Loss of Load Probability (LOLP) – though note that this is still quite low and (as with much of what AEMO does in the forecasting space) intended to elicit a market response.
We’ll watch that one with interest as summer rolls through….
(B) Something else to watch – via the Fair Work Commission
Also, for those unaware, it might also be worth noting some specific questions in these “Protection Action Ballots” at the Fair Work Commission in relation to a number of unions lined up in concert against Stanwell Corporation.
I found the following actions of particular interest:
Question 12: For an unlimited number of periods of one or more hours duration reducing the megawatt rate of change to 3.0 megawatts per minute on all in service units?
Question 18: The imposition of an unlimited number of bans of one or more hours duration, on the operation of one or more of the generators at the Tarong Power Stations to generate more than 180 megawatts of power output per generator?
I did have a question about “why Tarong?” given that the Stanwell portfolio is broader than that – however it’s possible that the 5-unit site was selected for greatest leverage in the negotiations between the unions and management.
For those not so familiar with the numbers, limiting output from a Tarong units to 180MW would reduce available supply by approximately 200MW – hence by a total of about 1,000MW across all 5 units if taken coincidentally. Compare that with a QLD region “back of the envelope” surplus forecast in the MT PASA run of 1,700MW or so (not including interconnector flow and so on).
In particular these actions (if taken) could make that LOLP figure in late January much higher indeed.
The details of the ballots from the relevant unions were all provided on the FWC website – and I found the details of interest in a number of respects.
The union ballots are here:
1) 54 employees registered with the CEPU (of which 72% voted)
2) 42 employees registered with the CFMMEU (of which 69% voted)
3) 22 employees registered with the ASU (of which 64% voted)
4) 21 employees registered with the AMWU (of which 57% voted)
5) 7 employees registered with the APESMA (of which 1 person voted)
6) 1 employee registered with the AIMPE (who voted)
————————–
Assuming no person is members of more than one union, that means 147 employees members of unions at Stanwell (of which 95 employees voted for the right to take action, such as in those 2 questions above).
A useful comparison to Stanwell’s Annual Report for 2017-18 which notes total employee numbers at 685:
- as at 30 June 2018; and
- across multiple sites (including Tarong site, which features in some of the questions on the ballot for reasons I have not time to delve much into).
Hence, unless my calculations are in error, it seems that:
- there is 21% coverage of total employee numbers within Stanwell Corporation by union membership (not sure how that compares with other organisations in the energy sector?)
- there were 14% of total employee numbers within Stanwell Corporation voted (not all of them YES, though the vast majority) for the right to take industrial action that would have a significant impact on (price, and possible security of supply) in the Queensland region, and possibly broader across much of the NEM (depending on when, and what action).
Unless I’ve made an arithmetical error, there’s something that does not seem to add up here, in terms of (over-sized?) leverage based on votes from 95 people.
Another point of interest as summer rolls through in Queensland


Leave a comment